
Figures & data
Figure 1 A patient’s epithelial defect highlighted by fluorescein stain under blue filter uploaded to AOS software.
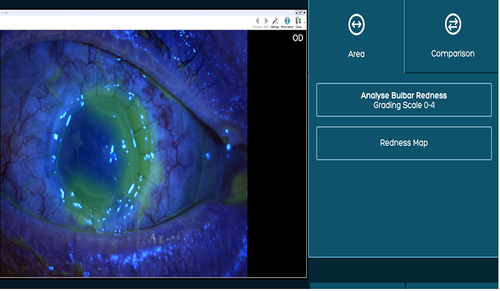
Figure 2 The white to white (WTW) is marked using the AOS software ruler tool. The highlighted epithelial defect is then measured (mm2) using the area tool in comparison to WTW measurement.
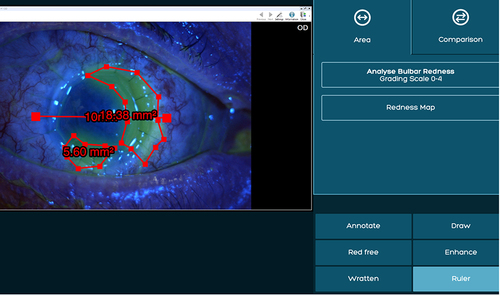
Figure 3 An example of temporal bulbar conjunctival inflammation score measurement followed by marking the desired area using the area tool.
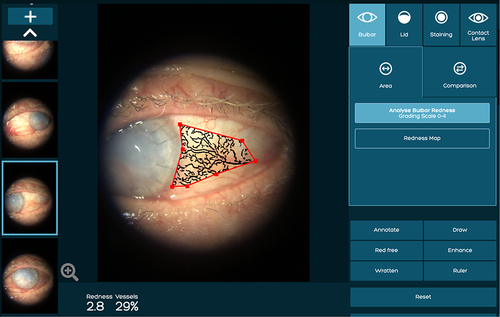
Table 1 Demographics of the patient cohort
Table 2 Patient etiology and duration of sutureless amniotic membrane treatment
Table 3 Breakdown of persistent epithelial defect patient cohort
Table 4 Concomitant medications
Table 5 Overall patient outcomes
Table 6 Degree of ocular surface inflammation: bulbar conjunctival blood vessel congestion scores through AOS digital assessment tool
Table 7 Follow-up treatments for patients following treatment with HAMDM
Table 8 Results of persistent epithelial defect treatment with amniotic membrane and plasma eye drops: comparison between studies