
Figures & data
Figure 1 Biomechanical model of head. Parts other than the eye were assumed to be rigid elements, and the impacting object was placed adjacent to the eyeball to reduce the computing time of the airbag impact simulation.
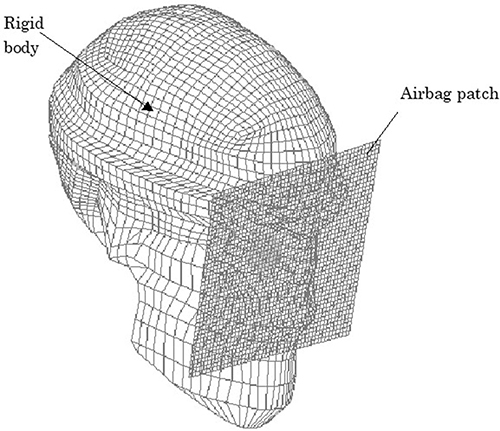
Figure 2 Deformation scale in simulation Color mapping scale of deformation of eye showing strain induced; warmer color of red represents greater deformation.
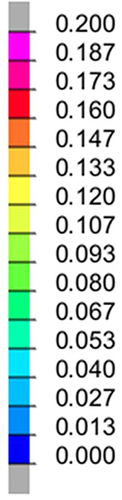
Figure 3 Sequential strain strength response of ocular surface of model eye upon airbag impact in 30° gaze-down position at 40 m/s with adhesion strength of scleral flap of 100%, shown in 0.4-ms intervals after 0.2 ms. Strain strength change is displayed in color as presented in the color bar scale ().
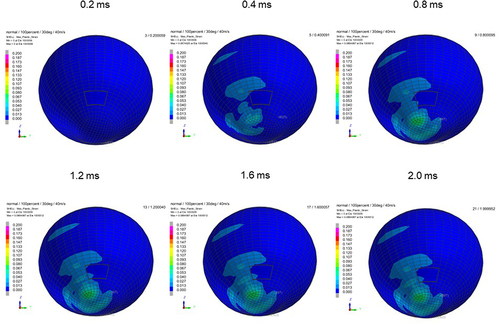
Figure 4 Sequential strain strength response of ocular surface of model eye upon airbag impact in 30°-gaze down position at 50 m/s with adhesion strength of scleral flap of 100%, shown at 0.4-ms intervals after 0.2 ms. Strain strength change is displayed in color as presented in the color bar scale ().
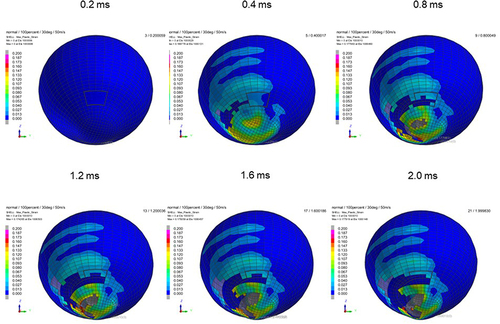
Figure 5 Sequential strain strength response of ocular surface of model eye upon airbag impact in 30°-gaze down position at 60 m/s with adhesion strength of scleral flap of 100%, shown at 0.4-ms intervals after 0.2 ms. Strain strength change is displayed in color as presented in the color bar scale ().
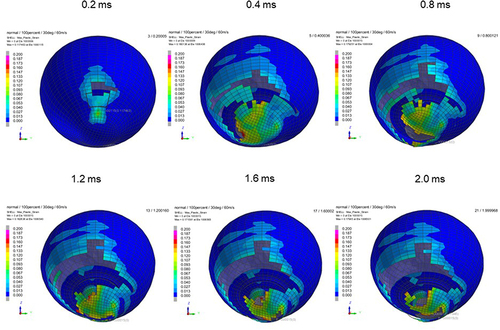
Figure 6 Sequential strain strength response of ocular surface of model eye upon airbag impact in 30°-gaze down position at 40 m/s with adhesion strength of scleral flap of 50%, shown at 0.4-ms intervals after 0.2 ms. Strain strength change is displayed in color as presented in the color bar scale ().
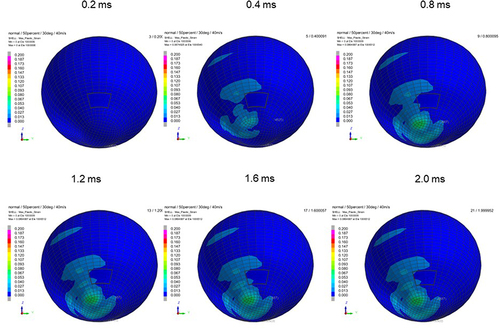
Figure 7 Sequential strain strength response of ocular surface of model eye upon airbag impact in 30°-gaze down position at 50 m/s with adhesion strength of scleral flap of 50%, shown at 0.4-ms intervals after 0.2 ms. Strain strength change is displayed in color as presented in the color bar scale ().
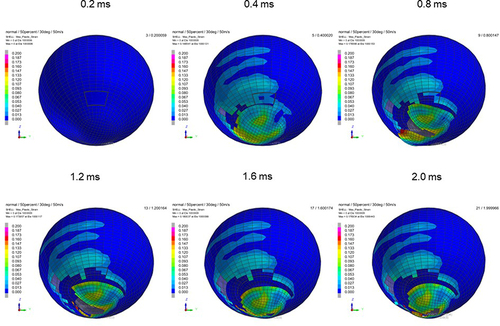
Figure 8 Sequential strain strength response of ocular surface of model eye upon airbag impact in 30°-gaze down position at 60 m/s with adhesion strength of scleral flap of 50%, shown at 0.4-ms intervals after 0.2 ms. Strain strength change is displayed in color as presented in the color bar scale ().

Figure 9 Sequential strain strength response of ocular surface of model eye upon airbag impact in 30°-gaze down position at 40 m/s with adhesion strength of scleral flap of 30%, shown at 0.4-ms intervals after 0.2 ms. Strain strength change is displayed in color as presented in the color bar scale ().
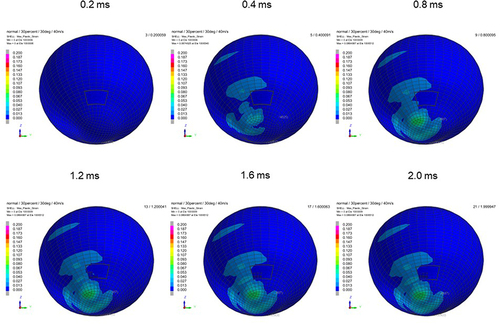
Figure 10 Sequential strain strength response of ocular surface of model eye upon airbag impact in 30°-gaze down position at 50 m/s with adhesion strength of scleral flap of 30%, shown at 0.4-ms intervals after 0.2 ms. Strain strength change is displayed in color as presented in the color bar scale ().
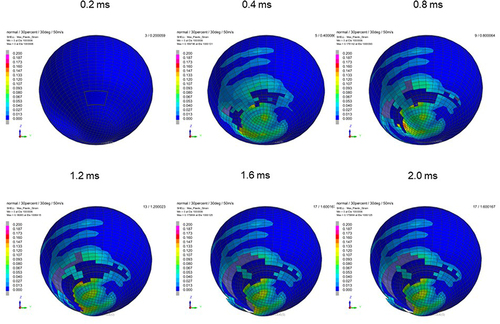
Figure 11 Sequential strain strength response of ocular surface of model eye upon airbag impact in 30°-gaze down position at 60 m/s with adhesion strength of scleral flap of 30%, shown at 0.4-ms intervals after 0.2 ms. Strain strength change is displayed in color as presented in the color bar scale ().
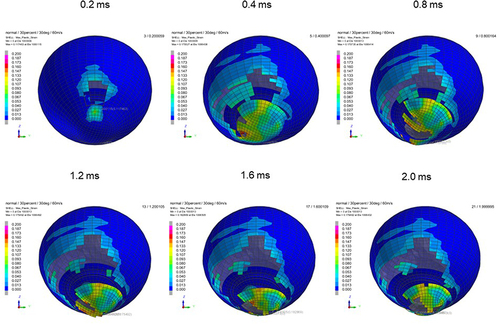
Figure 12 Sequential strain strength response of ocular surface of model eye upon airbag impact in straight position at 40 m/s with adhesion strength of scleral flap of 100%, shown at 0.4-ms intervals after 0.2 ms. Strain strength change is displayed in color as presented in the color bar scale ().
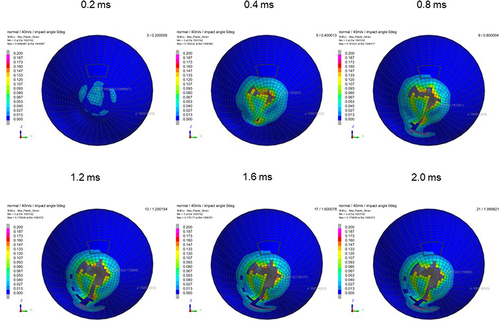
Figure 13 Sequential strain strength response of ocular surface of model eye upon airbag impact in straight position at 50 m/s with adhesion strength of scleral flap of 100%, shown at 0.4-ms intervals after 0.2 ms. Strain strength change is displayed in color as presented in the color bar scale ().
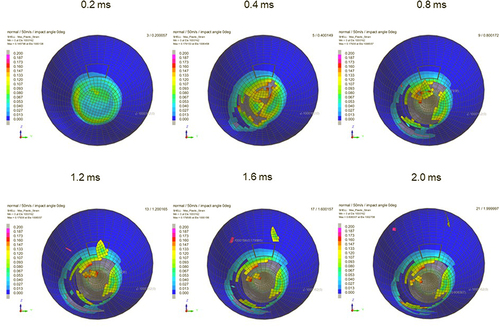
Figure 14 Sequential strain strength response of ocular surface of model eye upon airbag impact in straight position at 60 m/s with adhesion strength of scleral flap of 100%, shown at 0.4-ms intervals after 0.2 ms. Strain strength change is displayed in color as presented in the color bar scale ().
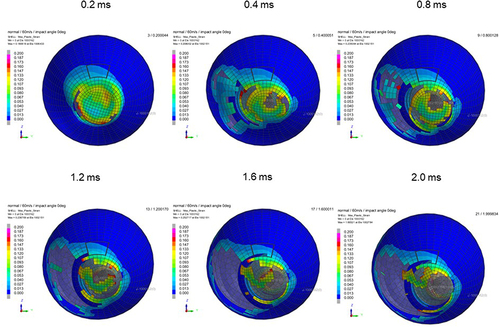
Figure 15 Sequential strain strength response of ocular surface of model eye upon airbag impact in straight position at 40 m/s with adhesion strength of scleral flap of 50%, shown at 0.4-ms intervals after 0.2 ms. Strain strength change is displayed in color as presented in the color bar scale ().
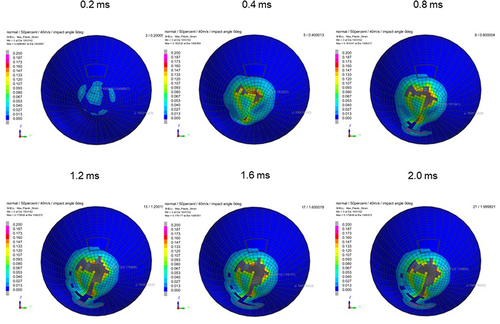
Figure 16 Sequential strain strength response of ocular surface of model eye upon airbag impact in straight position at 50 m/s with adhesion strength of scleral flap of 50%, shown at 0.4-ms intervals after 0.2 ms. Strain strength change is displayed in color as presented in the color bar scale ().
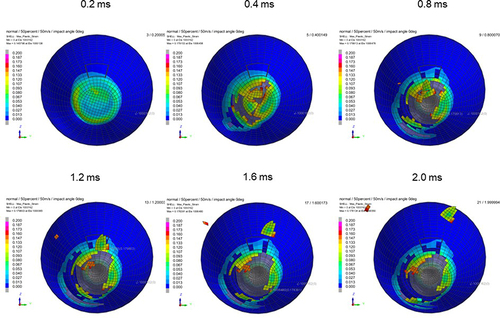
Figure 17 Sequential strain strength response of ocular surface of model eye upon airbag impact in straight position at 60 m/s with adhesion strength of scleral flap of 50%, shown at 0.4-ms intervals after 0.2 ms. Strain strength change is displayed in color as presented in the color bar scale ().
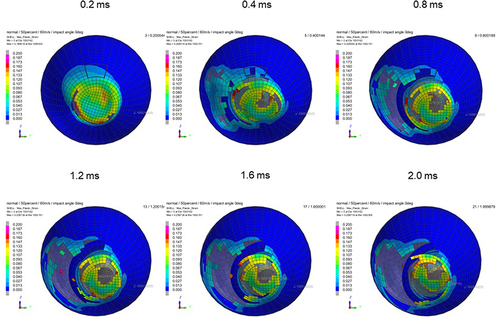
Figure 18 Sequential strain strength response of ocular surface of model eye upon airbag impact in straight position at 40 m/s with adhesion strength of scleral flap of 30%, shown at 0.4-ms intervals after 0.2 ms. Strain strength change is displayed in color as presented in the color bar scale ().
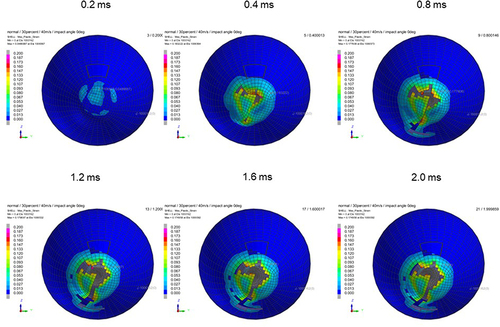
Figure 19 Sequential strain strength response of ocular surface of model eye upon airbag impact in straight position at 50 m/s with adhesion strength of scleral flap of 30%, shown at 0.4-ms intervals after 0.2 ms. Strain strength change is displayed in color as presented in the color bar scale ().
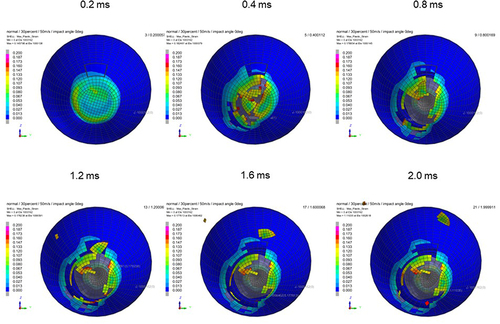
Figure 20 Sequential strain strength response of ocular surface of model eye upon airbag impact in straight position at 60 m/s with adhesion strength of scleral flap of 30%, shown at 0.4-ms intervals after 0.2 ms. Strain strength change is displayed in color as presented in the color bar scale ().
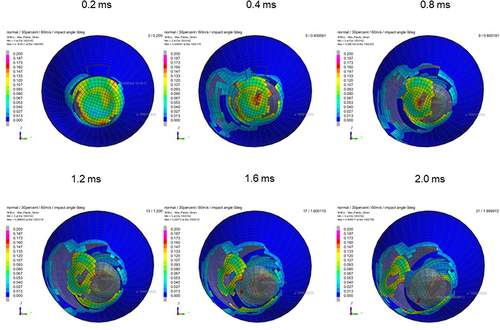
Table 1 Possibility of Globe Rupture at Each Airbag-Impact Velocity and Occurrence of Laceration After Impact in Eyes with 100% Scleral Flap Adhesion Strength
Table 2 Possibility of Globe Rupture at Each Airbag-Impact Velocity and Occurrence of Laceration After Impact in Eyes with 50% Scleral Flap Adhesion Strength
Table 3 Possibility of Globe Rupture at Each Airbag-Impact Velocity and Occurrence of Laceration After Impact in Eyes with 30% Scleral Flap Adhesion Strength