Figures & data
Table 1 Study Population Demographics
Table 2 Uncorrected and Corrected Visual Acuity of Each Eye by Age Group
Table 3 Frequency and Severity of Refractive Errors by Age Group
Table 4 Frequency and Severity of Refractive Errors in Amblyopia Population
Table 5 Frequency and Severity of Refractive Errors and Amblyopia in Each Congressional District
Table 6 PSM Analysis of Association Between MHI and Refractive Errors or Amblyopia
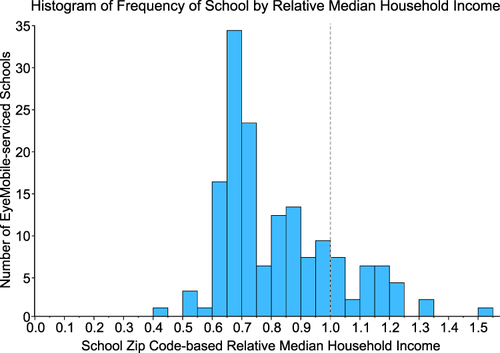
Figure 1 Histogram of frequency of EyeMobile-serviced schools by relative MHI. A total of 126 schools were in zip codes below the average MHI for OC, while 27 were above. The distribution of schools concentrates at a relative MHI of around 0.6–0.75.