
Figures & data
Table 1 Demographics, CNV Characterization and Respective Implemented Treatment
Figure 1 Graphic representation of the BCVA variation (on the right, (a)) at baseline (0), when anti-VEGF was suspended (1) and at last visit (2). On the left (b), the evolution of chorioretinal atrophic areas is displayed at the two last time points (1 and 2).
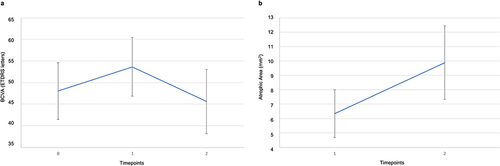
Figure 2 FAF images of two illustrative example patients from our cohort. FAF area at baseline (FAF0) and at the last visit (FAF2).
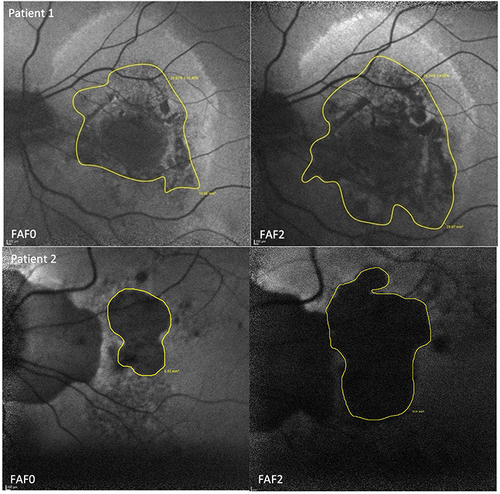
Figure 3 Correlations between BCVA at baseline (0), when anti-VEGF was suspended (1) and at last visit (2). We found a substantial positive correlation between BCVA0 and BCVA1 (0.675, p<0.001), a moderate positive correlation between BCVA0 and BCVA2 (0.437, p=0.008), and an almost perfect positive correlation between BCVA1 and BCVA2 (0.835, p<0.001). BCVA in ETDRS letters.
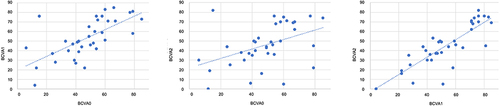
Figure 4 Linear correlation between atrophic area after anti-VEGF treatment suspension (FAF 1) and at last visit (FAF 2) on the right (a), and between FAF 1 and atrophic area growth rate (mm2/year) on the left (b). We found an almost perfect positive correlation between FAF1 and FAF2 (0.901, p<0.001) and a substantial positive correlation between FAF1 and atrophic area growth rate (0.673, p<0.001). FAF area in mm2; atrophic area growth rate in mm2/year.
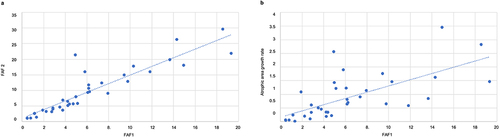
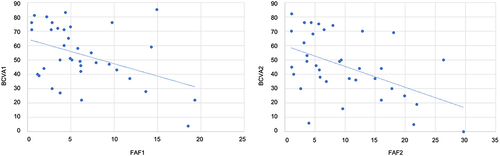
Figure 5 Linear correlation BCVA and atrophic area after anti-VEGF treatment suspension (BCVA1 vs FAF 1) and at last visit (BCVA2 vs FAF 2). We found a moderate negative correlation between BCVA1 and FAF1 (−0.410, p=0.013) and a reasonable correlation between BCVA2 and FAF2 (−0.341, p=0.042). BCVA in ETDRS letters; FAF area in mm2.
Data Sharing Statement
Access to any supplemental information is available upon reasonable request.