
Figures & data
Table 1 Demographics and Baseline Characteristics of Our Cohort of 127 Individuals
Table 2 Mean BCVA and Visit Intervals for Treatment-Naïve and Previously-Treated nAMD Patients
Figure 1 Best-corrected visual acuity (BCVA) and central subfield thickness (CST) in patients with neovascular age-related macular degeneration (nAMD) treated with faricimab. (A) Mean BCVA in treatment-naïve patients at visits 1 (baseline), 2, 3, 4 and 5, with each visit spaced at least 4 weeks apart. (B) Mean BCVA in previously-treated patients at visits 1 (baseline), 2, 3, 4 and 5, with each visit spaced at least 4 weeks apart. (C) Mean CST in treatment-naïve patients at initial and final loading dose visits. (D) Mean CST in previously-treated patients at initial and final loading dose visits.
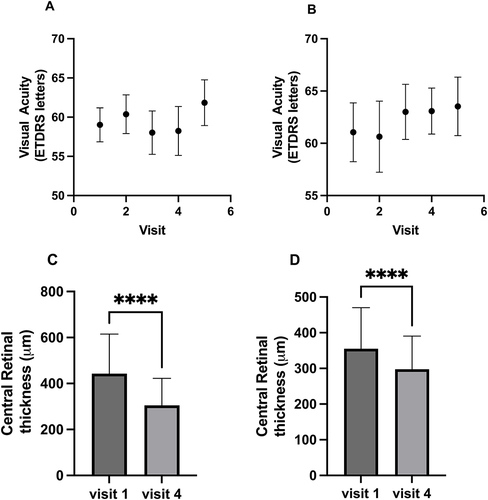
Figure 2 Qualitative changes in optical coherence tomography (OCT)-defined structural features of disease activity in patients with neovascular age-related macular degeneration (nAMD) after at least one injection of faricimab. (A) Proportions of treatment-naïve patients with OCT-derived structural markers of disease activity at visit 1 and visit 4. (B) Proportions of patients treated previously with anti-vascular endothelial growth factor agents exhibiting various markers of disease activity on OCT at visit 1 and visit 4.
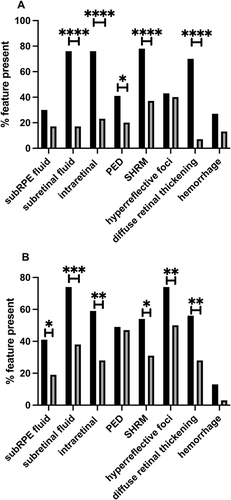
Table 3 Mean BCVA and Visit Intervals for Treatment-Naïve and Previously-Treated DME Patients
Figure 3 Best-corrected visual acuity (BCVA) and central subfield thickness (CST) within patients with diabetic macular edema (DME) treated with faricimab. (A) Mean BCVA in treatment-naïve patients at visits 1 (baseline), 2, 3, 4 and 5, with each visit spaced at least 4 weeks apart. (B) Mean BCVA in previously-treated patients at visits 1 (baseline), 2, 3, 4 and 5, with each visit spaced at least 4 weeks apart. (C) Mean CST in treatment-naïve patients at initial and final loading dose visits. (D) Mean CST in previously-treated patients at initial and final loading dose visits.
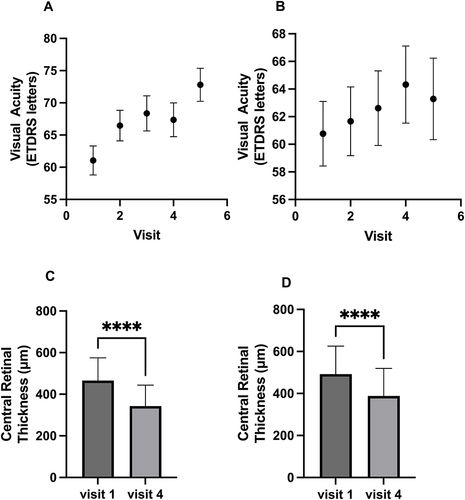
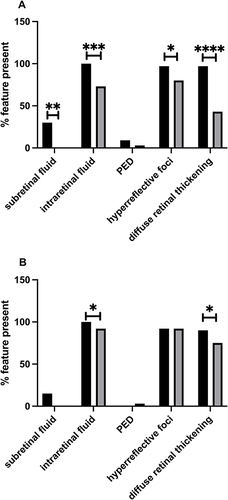
Figure 4 Qualitative changes in optical coherence tomography (OCT)-defined structural features of disease activity in patients with diabetic macular edema (DME) treated with faricimab. (A) Proportions of treatment-naïve patients exhibiting various markers of disease activity at visits 1 and 4. (B) Proportions of patients treated with previous anti-VEGF agents exhibiting various markers of disease activity on OCT at visits 1 and 4.
Data Sharing Statement
The datasets generated and/or analyzed during the current study are available from the corresponding author on reasonable request.