Figures & data

Table 1 Associations Between Clinical Characteristics and Retinal Detachment After Cataract Surgery in Children: A Statistical Analysis
Table 2 Comparative Analysis of Age and Timelines in Pediatric Patients with and without Retinal Detachment Following Cataract Surgery
Figure 1 Trend and Statistical Significance of Odds Ratios for Axial Length Based on p-values in Unadjusted Logistic Regression Analysis. The graph displays a dual-line representation of the relationship between the AL and the odds ratio in an unadjusted logistic regression analysis. The X-axis measures the AL in millimeters, while the first Y-axis (blue line with diamond spots) represents the odds ratios associated with each AL. This line demonstrates how the odds ratio changes as the AL increases, permitting the identification of trends such as increasing or decreasing probabilities related to different AL. The second Y-axis (Orange line with square spots) displays the corresponding p-values for each AL. The red dot line indicates the statistical significance of the odds ratios at various points, representing a p-value of ≤ 0.05.
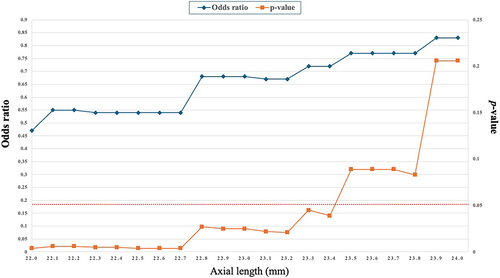
Table 3 Association Between Cataract Types and the Incidence of Retinal Detachment: Odds Ratios and Statistical Significance
Table 4 Impact of Axial Length Less or Equal to 23.4 mm, Myopia, IOL Insertion and Glaucoma on the Risk of Retinal Detachment: A Logistic Regression Analysis
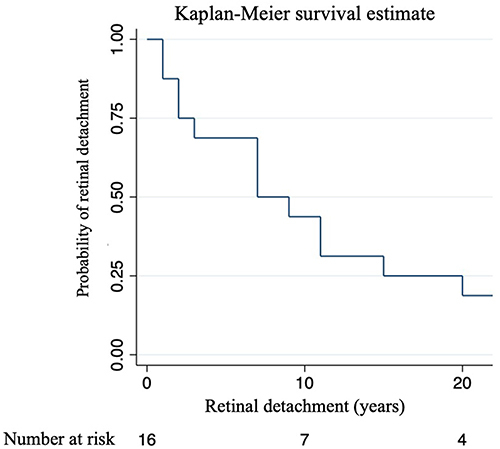
Figure 2 Retinal Detachment Risk Over Time: A Survival Analysis. The Kaplan-Meier plot illustrates the probability of RD in relation to the time of cataract surgery. The x-axis shows the time of cataract surgery in years, whereas the y-axis shows the probability of RD. Each mark on the graph signifies the likelihood of individuals being at risk after cataract surgery. The plot depicts the progression of the probability over time.