
Figures & data
Table 1 Patients’ Baseline Demographic Data
Figure 1 AS- OCT image of 2.2mm clear corneal incision created by the femtosecond laser.
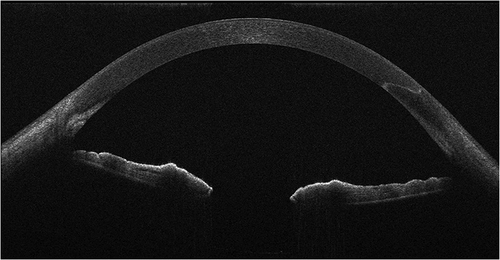
Table 2 Changes in Preoperative and Postoperative Uncorrected Distance Visual Acuity (LogMAR, Mean±SD)
Table 3 Proportions of Eyes with Different UDVA Levels at Postoperative 6 Months
Figure 2 Distribution of uncorrected distance visual acuity (UDVA) for different groups at 6 months after cataract surgery.
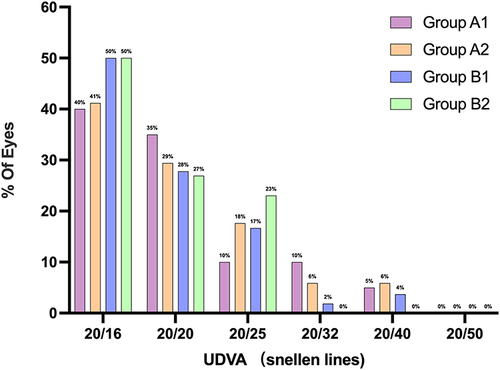
Table 4 Changes in Corneal Astigmatism
Figure 3 Changes in corneal astigmatism over different corneal zones for different groups during time. (A) for Group A1 and Group B1 over corneal 4mm zone.(B) for Group A1 and Group B1 over corneal 6mm zone.(C) for Group A2 and Group B2 over corneal 4mm zone.(D) for Group A2 and Group B2 over corneal 6mm zone.
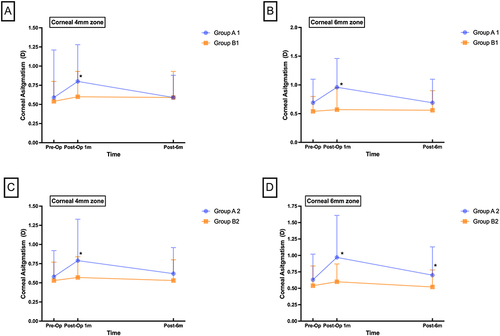
Table 5 Corneal Astigmatism Axis Shift
Figure 4 Double-angle vector diagrams of SIA over different corneal zones for different groups at 6 months postoperatively. (A) for Group A1; (B) for Group B1; (C) for Group A2; (D) for Group B2. The coordinates of SIA for each eye are shown with yellow dots, and centroid values are shown with black squares. Red cycle means 95% confidence ellipse of the centroid. Blue cycle means 95% confidence ellipse of the dataset. Each ring=0.50D.
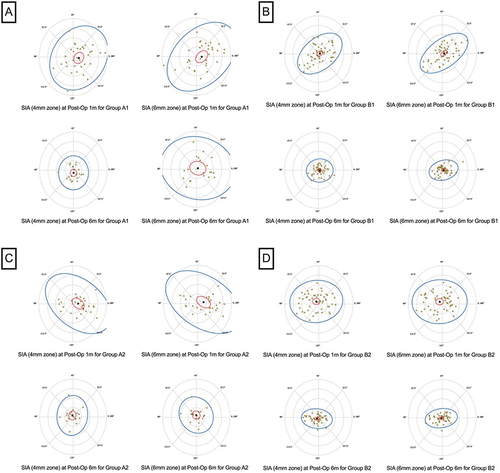
Table 6 SIA for Group a and Group B
Table 7 Correlation Analysis Between SIA and Preoperative Corneal Astigmatism, Corneal Curvature, Central Corneal Thickness
Data Sharing Statement
The data used during the current study are available from the corresponding author on reasonable request.