
Figures & data
Table 1 Demographic and Baseline Characteristics of Study Population
Table 2 Mean Intraocular Pressure and Glaucoma Medication Use at Each Study Visit
Figure 1 Mean intraocular pressure at each time point. Error bars represent standard deviation. Reductions from baseline were statistically significant at each time point (P<0.05).
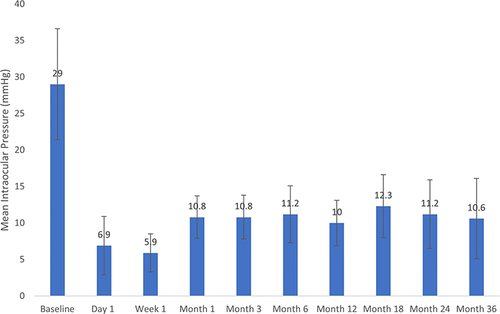
Figure 2 Mean glaucoma medication use at each time point. Error bars represent standard deviation. Reductions from baseline were statistically significant at each time point (P<0.05).
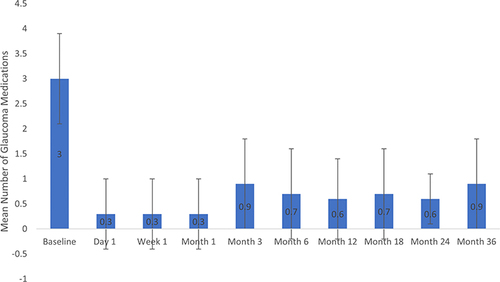
Table 3 The Nature and Frequency of Postoperative Complications
Data Sharing Statement
The author’s institution does not authorize data sharing. Any queries or requests should be directed to the corresponding author (SD).