
Figures & data
Figure 1 Power map (1a) and power profile (1b) of the catenary curve-based optic. Hartmann-Shack wavefront sensing revealed a rotationally symmetric wavefront measurement, that can be decomposed into mainly primary and secondary spherical aberrations (1a), power conversion resulted in a catenary curve shaped center-distance power profile (1b).
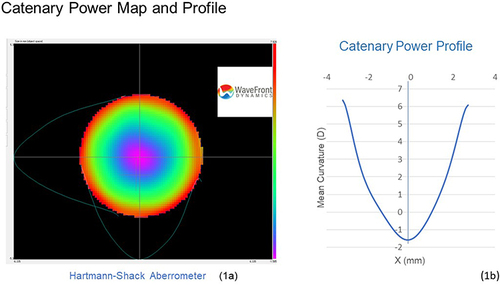
Figure 2 Catenary curve-based optic generates an ultra-elongated depth-of-focus channel. Continuously changing curvature provides a series of focal points along the visual axis, effectively neutralizing vergences from different object distances and elongating the range of clear vision.
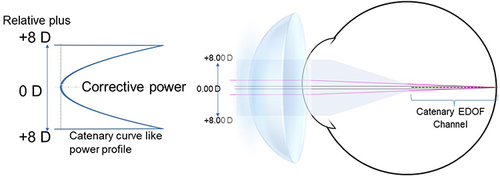
Figure 3 Binocular defocus curve of intraocular lenses. The dioptric value on the x-axis represents the change of vergence from infinity (0.00); where −2.50 D represents 40cm. The dash line represents the threshold of functional vision, 0.30 logMAR (20/40, equivalent to Arial font size 7 at 40 cm). Areas above the line and below the defocus curve is considered to be areas of functional vision. Vergence range with logMAR value 0.30 or better (smaller) is the range of clear vision.
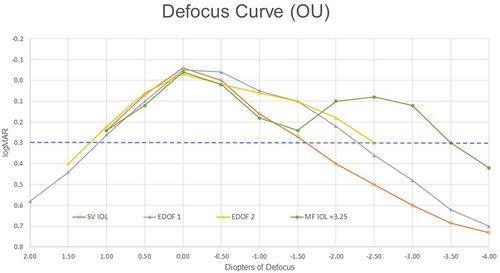
Table 1 Binocular logMAR Scores
Figure 4 Comparison of monocular defocus curves. Monocular defocus data from the Baseline was collected with sphero-cylindrical correction using trail lenses. Catenary defocus data was collected from the same subjects wearing the catenary curve-based contact lens. Error bar represents standard error. * significance at the P < 0.05; ** significance at the P < 0.001. High illumination/high contrast conditions.
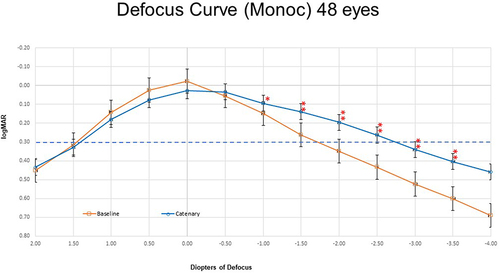
Figure 5 Comparison of binocular defocus curves. Binocular defocus data from the Baseline was collected with sphero-cylindrical correction using trail lenses. Catenary defocus data was collected from the same subjects wearing the catenary curve-based contact lens. Error bar represents standard error. ** significance at the P < 0.001. High illumination/high contrast conditions.
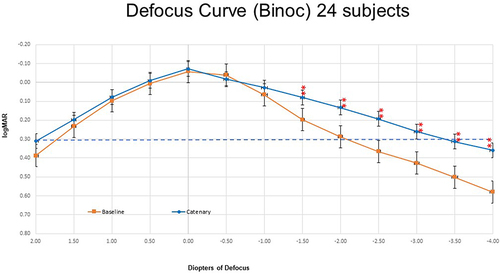
Table 2 Subjective Assessment Scale from the Catenary-Lens Performance
Data Sharing Statement
The data that support the findings of this study are available from the corresponding author, DPB, upon reasonable request.