
Figures & data
Figure 1 WaveMaster® IOL 2 test setup.
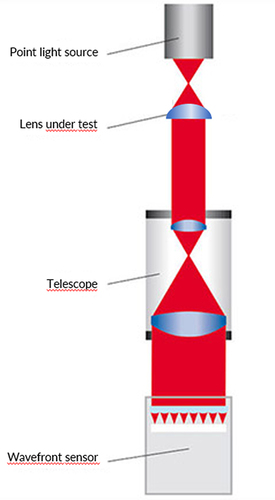
Figure 2 (A and B) Through frequency MTF of PureSee® IOL. Through frequency MTF with different defocus, 3 mm aperture (A) and 4.5 aperture (B), with special interest for MTF between 0 and 100 lp/mm.
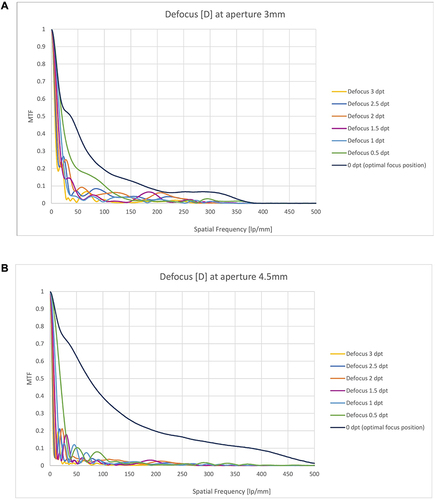
Figure 3 (A and B) Through focus MTF of PureSee® IOL. Through focus MTF at 50 lp/mm for an aperture of 3 mm (A) and 4.5 mm (B).
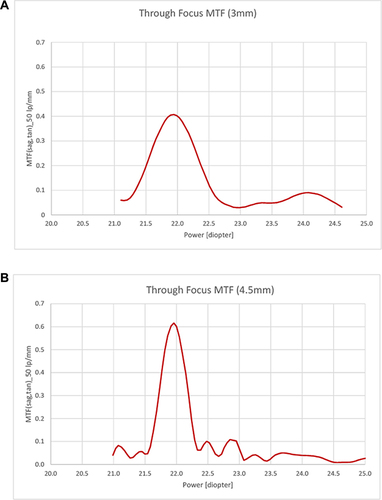
Figure 4 (A and B) MTFa of PureSee® IOL. Area under the modulation transfer function curve (MTFa) at defocus 0 D to −3 D, for an aperture of 3 mm (A) and 4.5 mm (B).
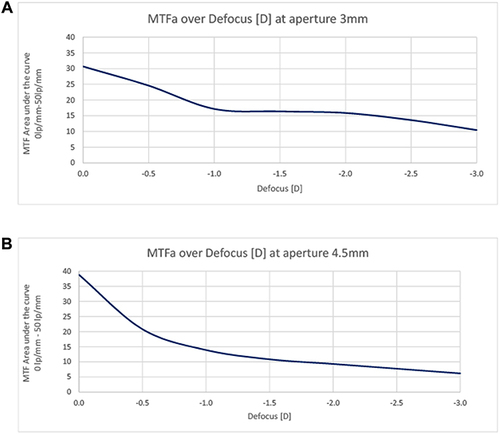
Figure 5 (A and B) Simulated visual acuity. Simulated visual acuity for 3 mm aperture (A) and 4.5 aperture (B) at defocus 0 D to −3 D.
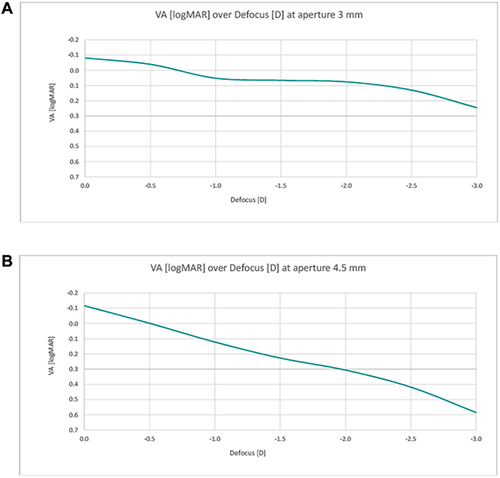
Table 1 Higher Order Aberrations (Zernike Polynomials) Obtained for TECNIS® PureSee® IOL. Significant Zernike Coefficients are Found to Be Primary and Secondary Spherical Aberration (>0.2 µm)
Figure 6 2D Wavefront mapping (Shack-Hartmann) of TECNIS® PureSee® IOL.
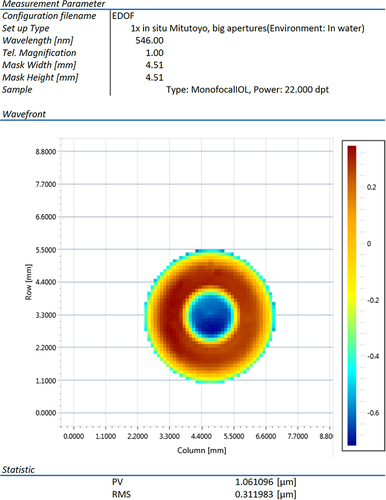
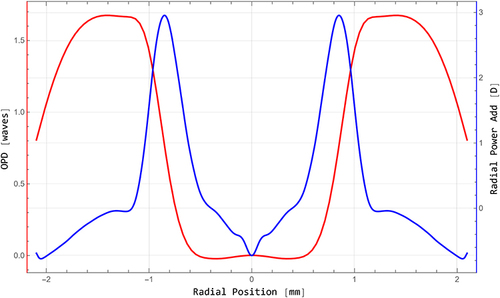
Figure 7 Detailed, meridionally averaged wavefront (red) and calculated power (blue) profile of PureSee® IOL (Shack-Hartmann Sensor). The central dip represents an artifact caused by wavefront reconstruction.
Data Sharing Statement
All data analyzed in this study are included in this article. Further inquiries can be directed to the corresponding author.