Figures & data
Table 1 Demographic features of enrolled subjects
Table 2 GDx VCC parameters of enrolled subjects
Table 3 Percentage and cumulative percentage explained by each factor (R-mode) for normal, no retinopathy, and with retinopathy groups
Figure 1 Varimax rotated factor loadings for the normal group of the four factors. NFI shows negative correlation with TSNIT, superior and inferior average, as it is expected, and shows no relation with other ocular parameters, such as CCT and normal IO.
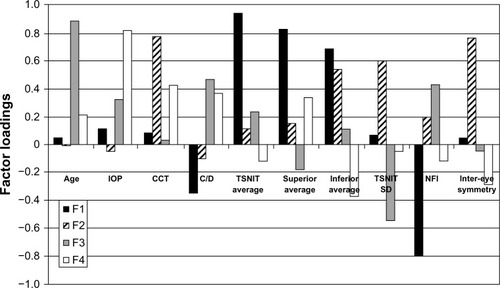
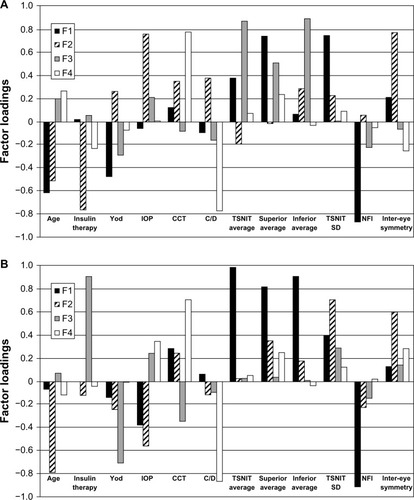
Figure 2 Varimax rotated factor loadings for the “no retinopathy” group of the four factors (A). Varimax rotated factor loadings for the “with mild retinopathy” group of the four factors (B). The results for F1 of the mild retinopathy group are similar to F1 of the normal group analysis and resample those of the “no retinopathy” group.