Figures & data
Figure 1 Swelling of the right lower eyelid due to the tumor in the anterior inferior orbit.
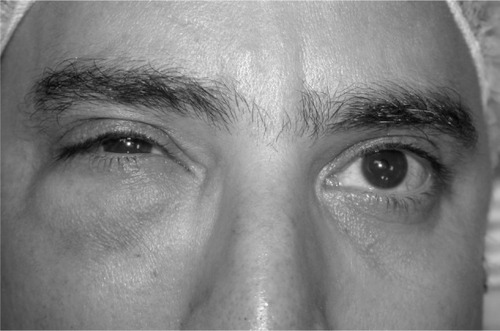
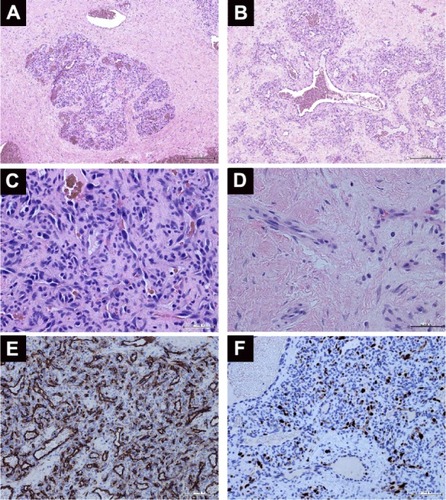
Figure 2 Histopathological analysis of an orbital hemangiopericytoma.
Notes: (A) Low-power view showing the lobular pattern of highly cellular areas separated by fibrous tissue (hematoxylin and eosin [H&E], 40×). (B) Large, dilated vascular channels within the neoplastic cells (H&E, 100×). (C) A high-power view of the cellular areas (H&E, 400×). (D) The fibrotic areas separating the lobules were mostly acellular (H&E, 400×). (E) Factor VIII-positive immunostaining (100×). (F) Ki-67 immunostaining (200×).