Figures & data
Figure 1 Right (A) and left (B) fundus photographs showing diffuse optic disc pallor in both eyes.
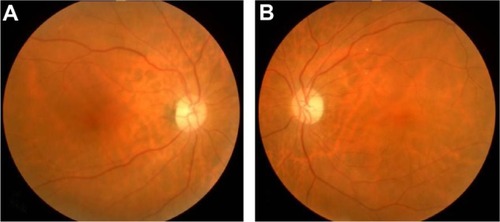
Figure 2 Right (A) and left (B) Goldmann perimetry showed constriction of the I/2 e isopter in both eyes.
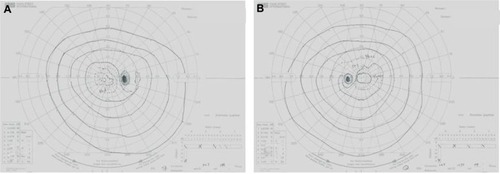
Figure 3 Results of right (A–F) and left (G–L) white-on-white perimetry (A–C and G–I) and blue-on-yellow perimetry (D–F and J–L). Gray-tone scale (A, D, G, and J), total deviation map (B, E, H, and K) and pattern standard deviation map (C, F, I, and L) for white-on-white and blue-on-yellow perimetry. Note that blue-on-yellow perimetry captured the visual field abnormalities more effectively than white-on-white perimetry.
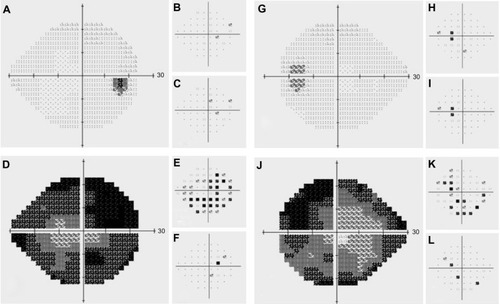
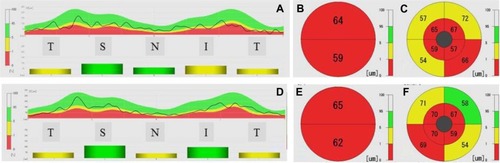
Figure 4 Right (A–C) and left (D–F) optical coherence tomography scans showing decreased retinal thickness.
Notes: A and D: RNFL map, B and E: RNFL + GCL + IPL map (9.0 mm), C and F: RNFL + GCL + IPL map (1.5/4.5/9.0 mm).
Abbreviations: RNFL, retinal nerve fiber layer; GCL, ganglion cell layer; IPL, inner plexiform layer; T, temporal; S, superior; N, nasal; I, inferior.
Abbreviations: RNFL, retinal nerve fiber layer; GCL, ganglion cell layer; IPL, inner plexiform layer; T, temporal; S, superior; N, nasal; I, inferior.