
Figures & data
Figure 1 Summed responses for multifocal electroretinographic recordings with twin-flash application showing amplitude recovery of the second flash with increasing ISIs of 17, 33, 50, and 67 msec.
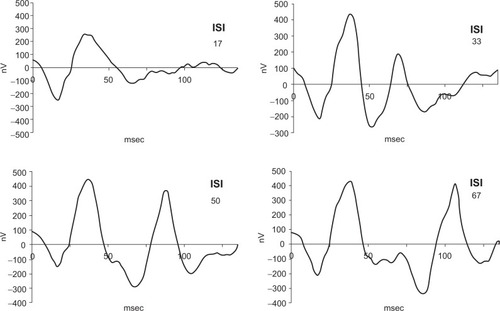
Figure 2 Mean response amplitudes of the second flashes with twin flash application after ISI of 33 msec (red), 50 msec (blue), and 67 msec (green) in relation to the first flash responses (white). The ISI 33 responses are significantly smaller than the first responses, with no significant difference seen between the first and ISI 50 and ISI 67 responses.
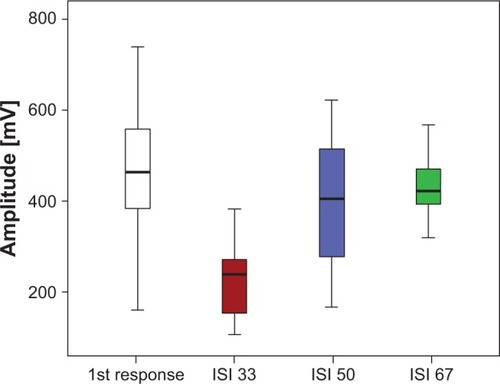
Figure 3 Multifocal electroretinographic result for a normal subject with triple-flash stimulation with three peaks in each response. The largest first peak is the response after an interval of >85 msec, the second peak after 25 msec, and the third after 35 msec.
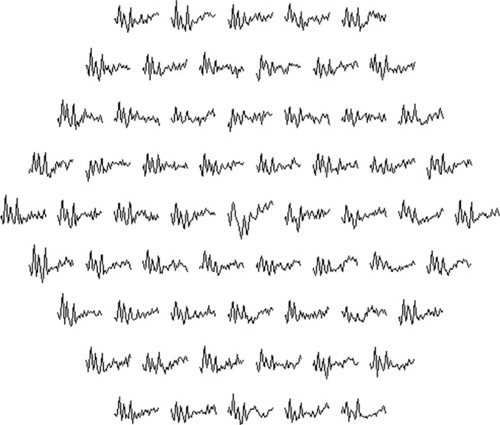
Figure 4 Ring analysis for the same subject. Green, ring 1; red, ring 2; brown, ring 3; orange, ring 4; and blue, ring 5.
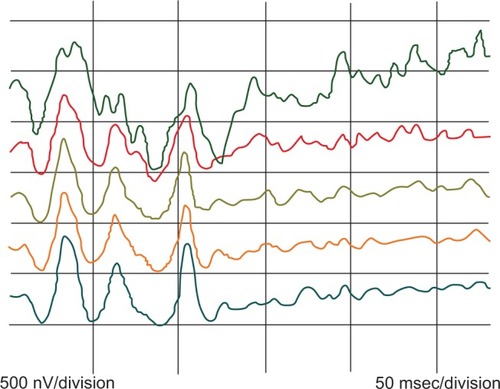
Figure 5 Amplitude recovery kinetics based on the measured interstimulus interval of ring 3 for the same subject.
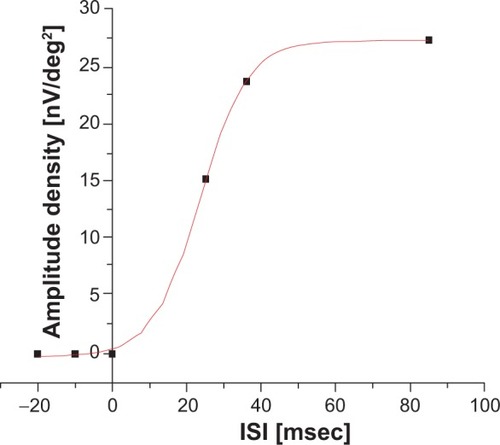
Figure 6 Half-lives of the amplitude recovery kinetics showing more rapid recovery peripherally.
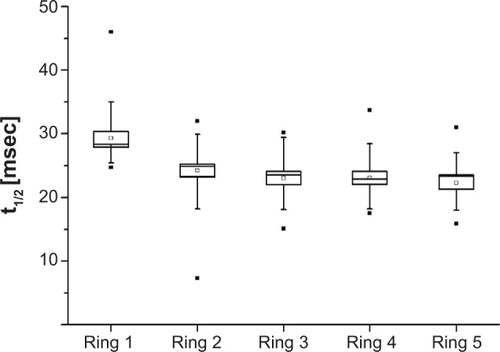
Table 1 Mean amplitude densities and standard deviations for concentric ring responses at the three stimulated peaks of P85, P25, and P35 (nV/deg2)