Figures & data
Figure 1 Slit-lamp photograph of an eye with keratoconus demonstrating increased corneal curvature (ectasia).
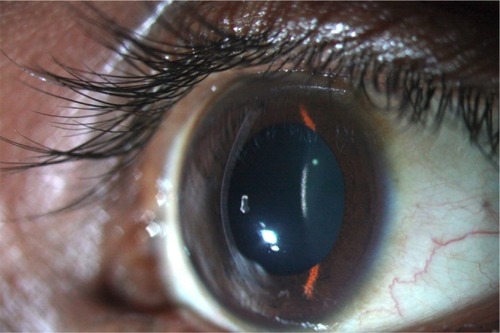
Figure 2 Slit-lamp and anterior segment optical coherence tomographic images of the right eye of a 16-year-old boy with atopy, vernal keratoconjunctivitis, and advanced keratoconus who presented with acute corneal hydrops after an episode of severe eye-rubbing. Corneal edema decreased gradually from presentation (left panel, day 18 after onset of corneal hydrops) to 2 months (middle panel) and 4 months (right panel) thereafter. The patient was treated conservatively with topical steroids and hyperosmotic eye drops. The break and persistent detachment of the Descemet’s membrane (white arrowheads) is clearly discernible on anterior segment optical coherence tomographic imaging.
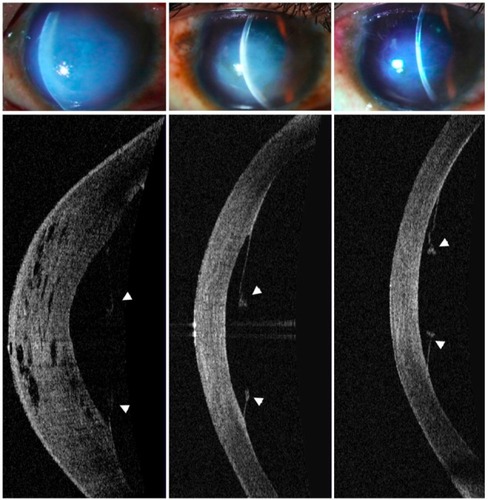
Figure 3 Anterior segment optical coherence tomography image of an eye with keratoconus, demonstrating central thinning of the cornea.
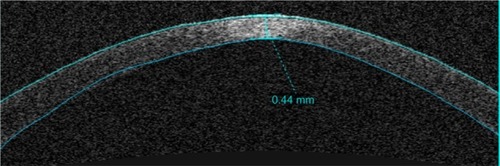
Figure 4 Slit-lamp photograph of the same eye as in , showing apical scarring (yellow arrow) and Vogt’s striae (white arrow).
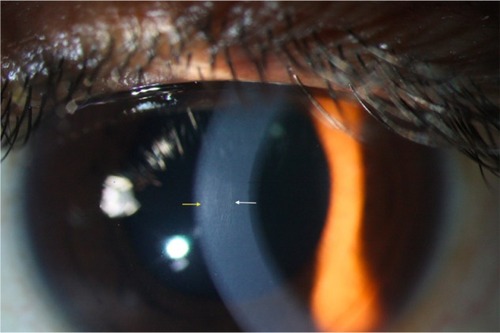
Figure 5 Slit-lamp photograph of the same eye as in and , showing Fleischer’s ring (white arrows).
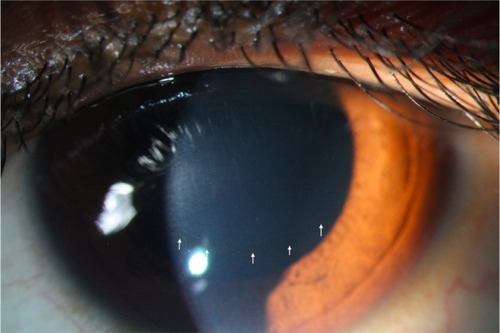
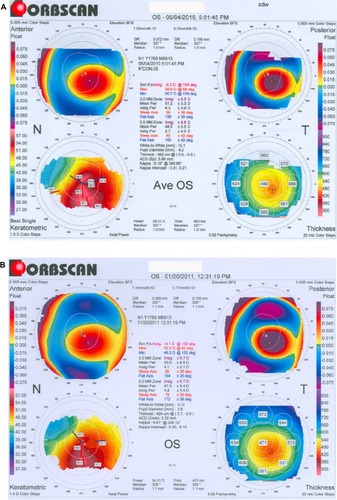
Figure 6 Tomography maps (Orbscan IIz, Bausch and Lomb, Rochester, NY, USA) before (A) and 9 months after (B) collagen crosslinking showing flattening of corneal surface. Maximum and minimum simulated keratometry values show a decrease of 2.8 and 1.5 diopters, respectively.