Figures & data
Table 1 Sellman and Lindstrom posterior capsule opacification (PCO) gradesCitation11
Table 2 Madurai intraocular lens study IV scale for optic disc visualizationCitation12
Table 3 Macula visualization scale used by Aslam and PattonCitation13
Figure 1 Sex distribution among nondiabetic patients (n = 25) in the study.
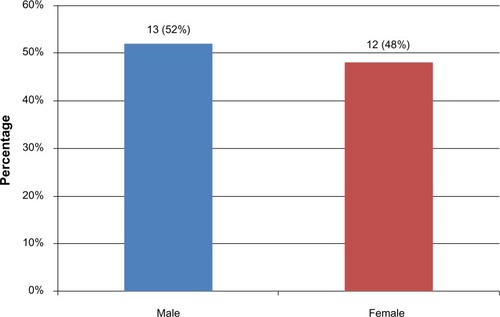
Figure 2 Sex distribution among diabetic patients (n = 25) in the study.
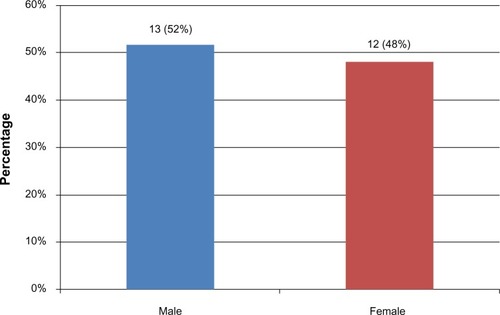
Figure 3 Comparison between nondiabetic (n = 25) and diabetic (n = 25) study groups of time elapsed since cataract surgery.
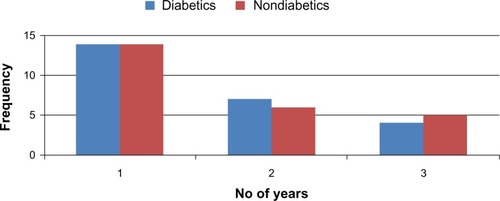
Table 4 Types of posterior capsule opacification (PCO) in diabetics and nondiabetics (N = 50) with P values
Table 5 Frequency of comorbid systemic and ocular diseases in patients
Figure 4 Comparison of pre- and postsurgical visual acuity among nondiabetic study participants (n = 25).
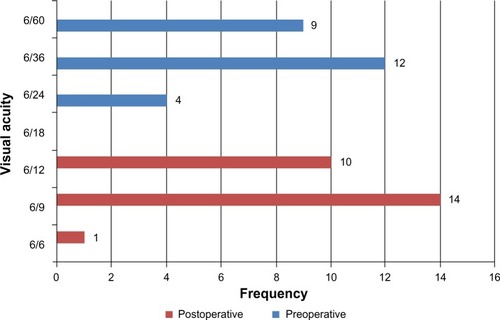
Figure 5 Comparison of pre- and postsurgical visual acuity among diabetic study participants (n = 25).
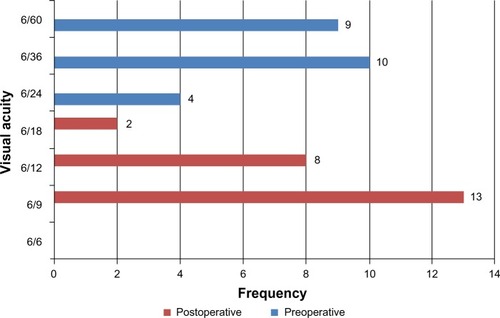
Table 6 Postoperative visual acuity after Nd:YAG laser capsulotomy (mean ± standard deviation)