Figures & data
Figure 1 (A) Color fundus photograph of geographic atrophy, secondary to age-related macular degeneration, showed a rounded, depigmented area with well-defined margins. (B) Fluorescein angiography demonstrated hyperfluorescence due to a window defect. (C) The Stratus optical coherence tomography image showed backscatter in the zones of atrophy, with marked hyperreflectivity and retinal thinning in the entire zone of atrophy.
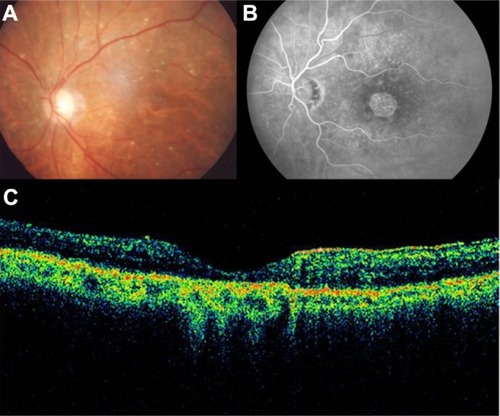
Figure 2 Geographic atrophy. (A) Fluorescein angiography demonstrated hyperfluorescence due to a window defect and central sparing. (B) Stratus optical coherence tomography image showing a significant loss of the outer nuclear layer, photoreceptors, and the retinal pigment epithelium, leading to significant hyperreflectivity and backscatter within the choroid.
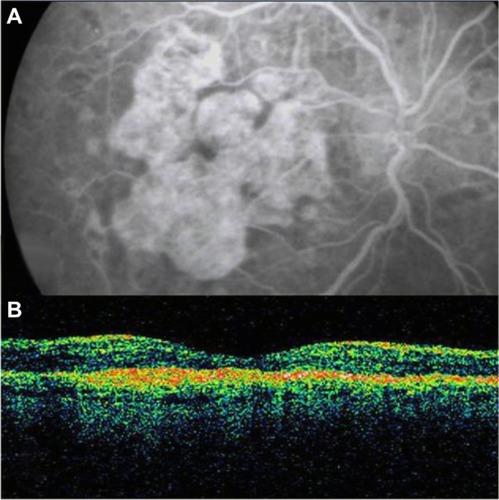
Figure 3 (A) Color photograph. (B) Cirrus™ optical coherence tomography image.
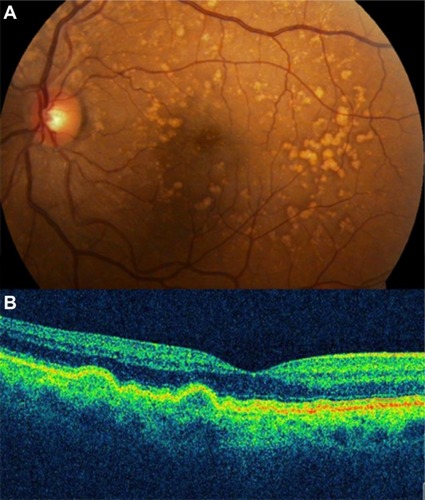
Figure 4 (A and B) Bilateral drusenoid pigment epithelial detachment is observed on Cirrus™ optical coherence tomography.
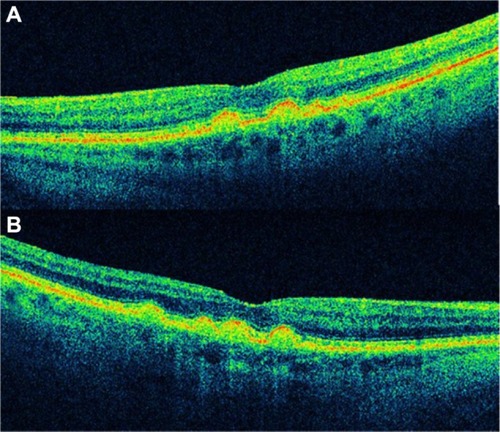
Figure 5 Cirrus™ optical coherence tomography scan.
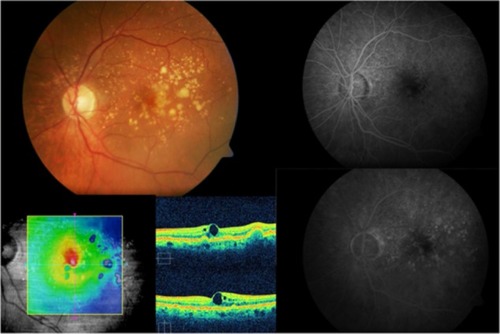
Figure 6 Cirrus™ optical coherence tomography scan.
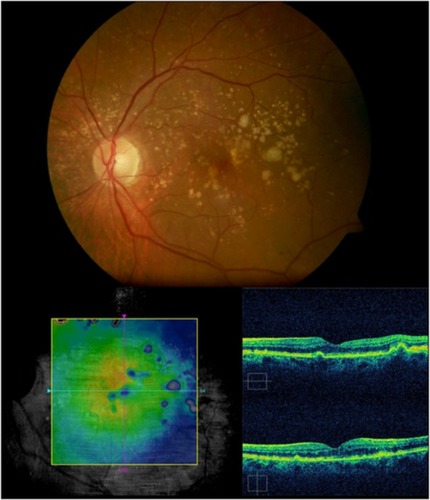
Figure 7 Stratus optical coherence tomography image.
Abbreviation: pigment PED, epithelial detachment.
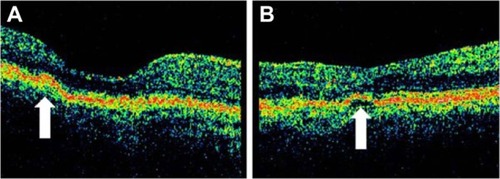
Figure 8 Stratus optical coherence tomography image.
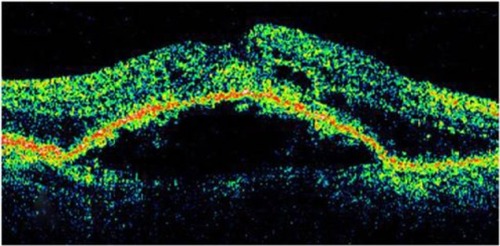
Figure 9 In this Cirrus™ optical coherence tomography image, we can see the sharply demarcated classic edges of the dome on a pigment epithelial detachment.
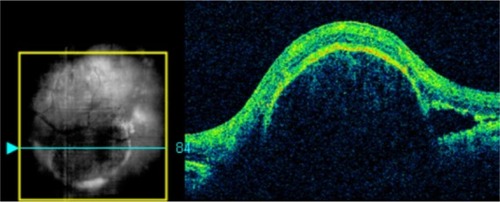
Figure 10 Stratus optical coherence tomography image.
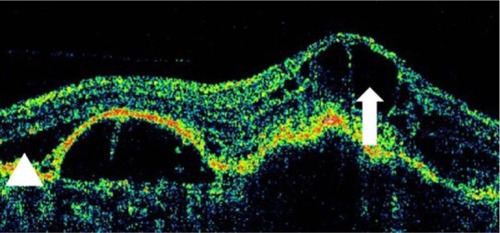
Figure 11 This Cirrus™ optical coherence tomography section demonstrates an elevation of the macular region with loss of the foveal depression.
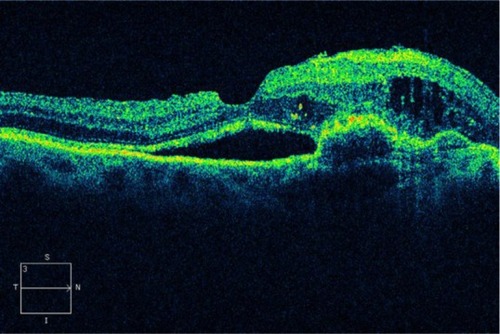
Figure 12 The combination of a pigment epithelium detachment with accompanying subretinal fluid and intraretinal fluid may be a sign of choroidal neovascularization or retinal angiomatous proliferation, in this Cirrus™ optical coherence tomography image.
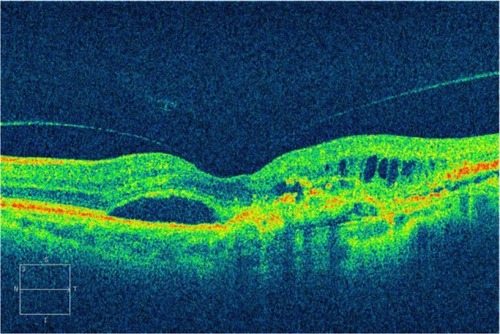
Figure 13 (A–D) The histopathologic (artist representation) and clinical correlation of occult and classic choroidal neovascularization to the Gass classification of type I (A and B) and type II membranes (C and D).
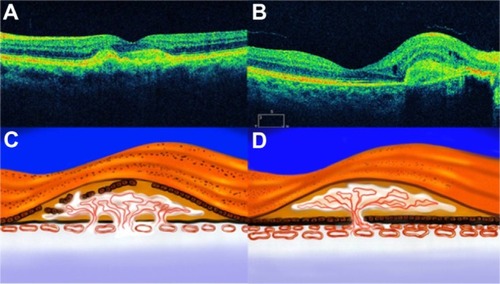
Figure 14 Choroidal neovascularization.
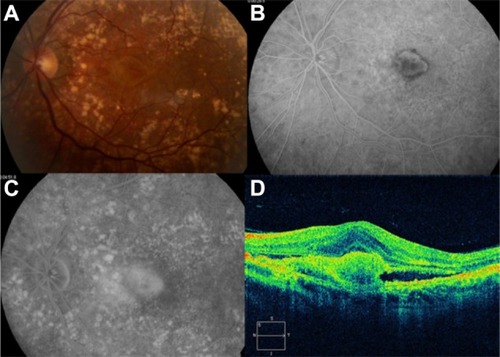
Figure 15 Choroidal neovascularization in age-related macular degeneration.
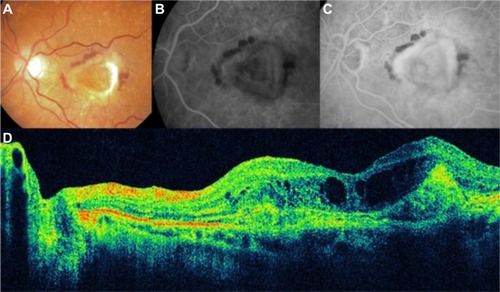
Figure 16 Choroidal neovascularization in age-related macular degeneration.
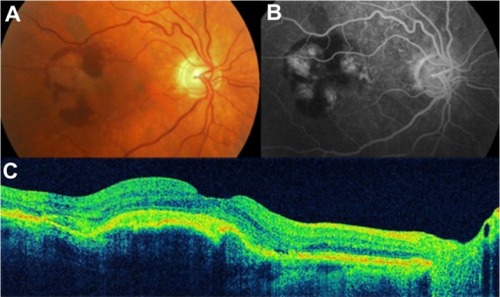
Figure 17 Choroidal neovascularization in age-related macular degeneration.
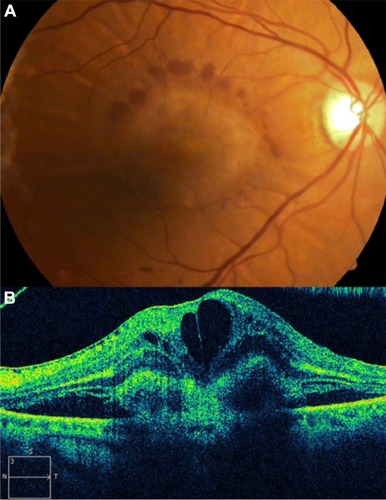
Figure 18 Cirrus™ optical coherence tomography image shows a hyperreflective band, suggesting residual fibrosis of classic choroidal neovascularization.
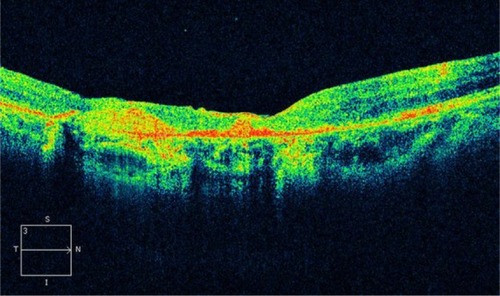
Figure 19 Disciform scar in age-related macular degeneration.
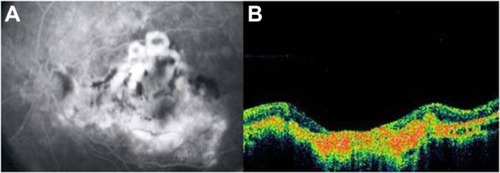
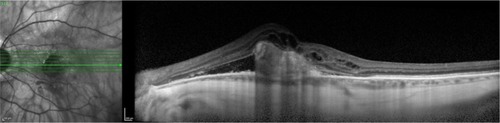
Figure 20 Vitreomacular traction syndrome and geographic atrophy.
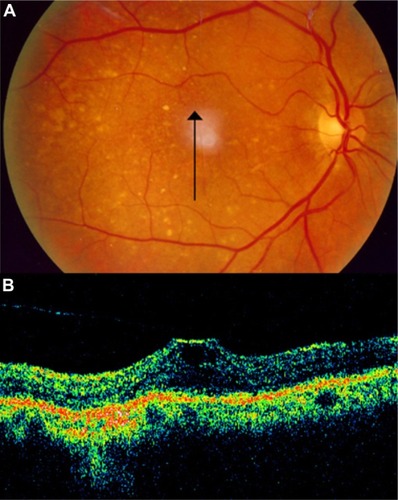
Figure 21 Vitreomacular traction syndrome and geographic atrophy.
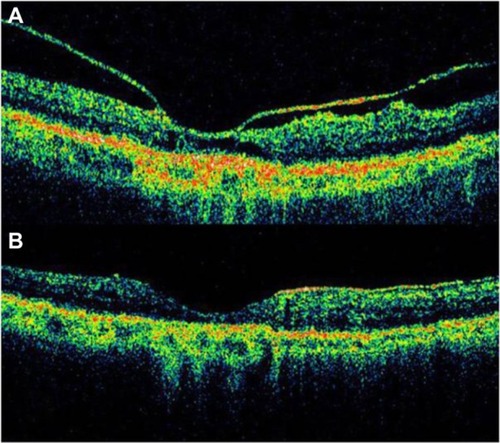
Figure 22 Laser treatment of subretinal neovascularization leads to atrophic scarring, which appears, on Cirrus™ optical coherence tomography, as highly reflective at the chorioretinal interface.
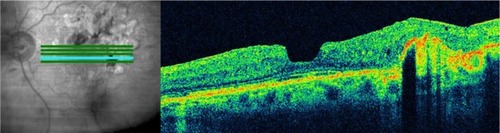
Figure 23 (A and B) Fluorescein angiography shows diffused diabetic macular edema. (C) Stratus optical coherence tomography illustrates diffuse retinal thickening and cystic spaces, consistent with cystoid macular edema.
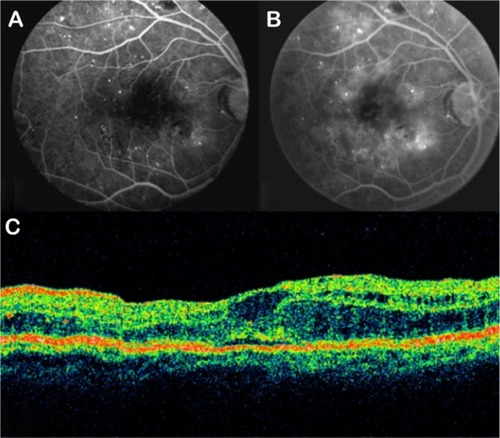
Figure 24 Stratus optical coherence tomography image.
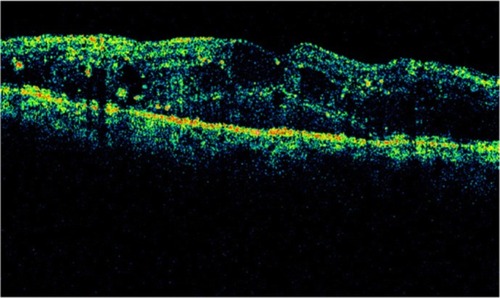
Figure 25 Cirrus™ optical coherence tomography image.
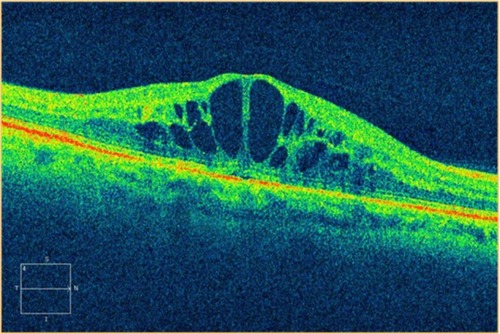
Figure 26 Stratus optical coherence tomography image.
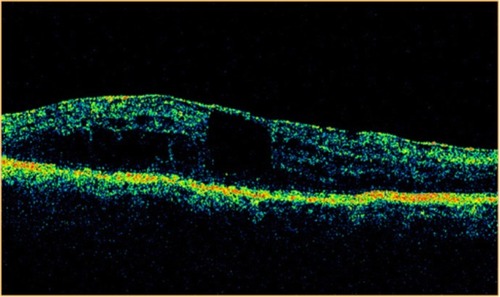
Figure 27 Stratus optical coherence tomography image.
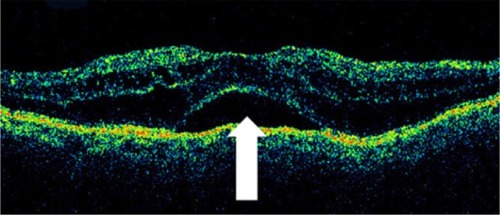
Figure 28 Stratus optical coherence tomography image.
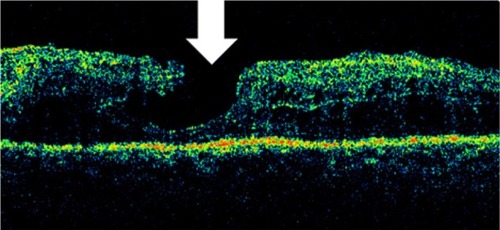
Figure 29 Stratus optical coherence tomography image.
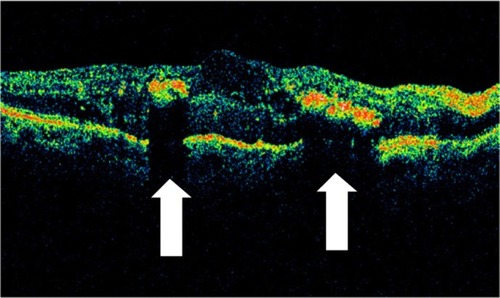
Figure 30 Stratus optical coherence tomography image.
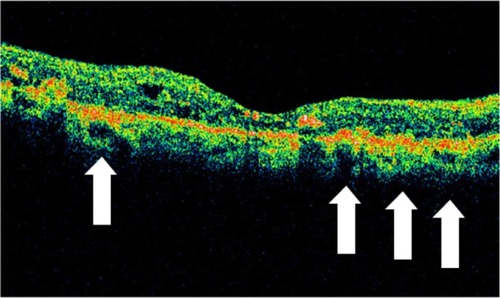
Figure 31 (A and B) Subhyaloid hemorrhage absorbs and reflects much of the Stratus optical coherence tomography light and hence, creates a large shadow obscuring the underlying structures.
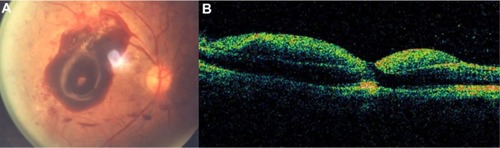
Figure 32 (A) Fundus photography, (B) fluorescein angiogram, and (C) Stratus optical coherence tomography of proliferative diabetic retinopathy with preretinal membranes (thin, reflective bands anterior to the retina) and cystoid macular edema.
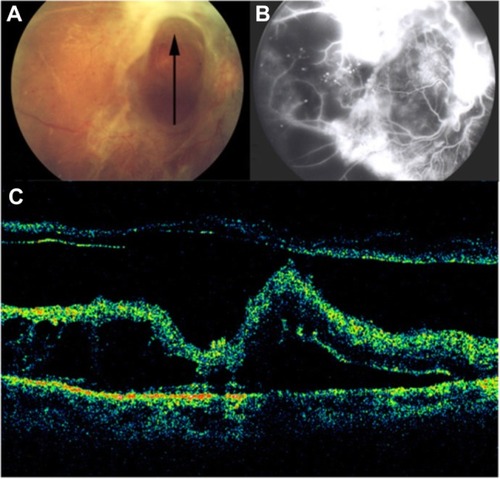
Figure 33 (A) Fundus photography, (B) fibrovascular proliferations of the optic disc (B-line), and (C) Cirrus™ optical coherence tomography of proliferative diabetic retinopathy with retinal traction and tractional detachment (C-line).
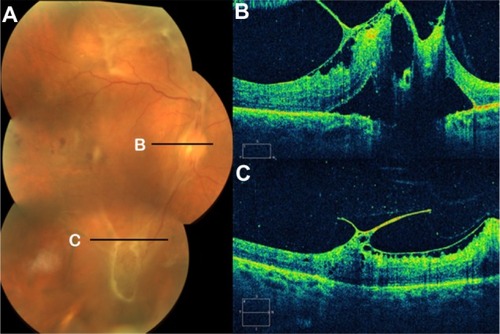
Figure 34 (A) Fundus photography, (B) fluorescein angiogram, and (C) Stratus optical coherence tomography of proliferative diabetic retinopathy with retinal traction and detachment.
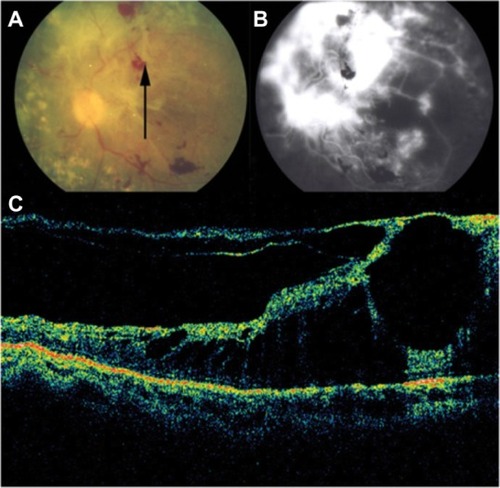
Figure 35 Stratus optical coherence tomography image.
Figure 36 Retinal thinning (arrow) corresponding to retinal atrophy can be defined by Stratus optical coherence tomography, in the region of photocoagulation treatment.
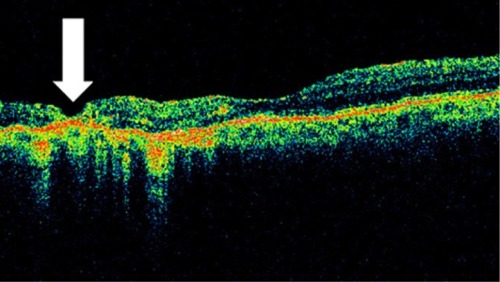
Figure 37 Stratus optical coherence tomography image.
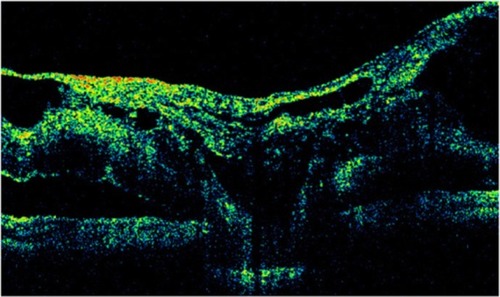
Figure 38 Stratus optical coherence tomography can determine the vitreous state.
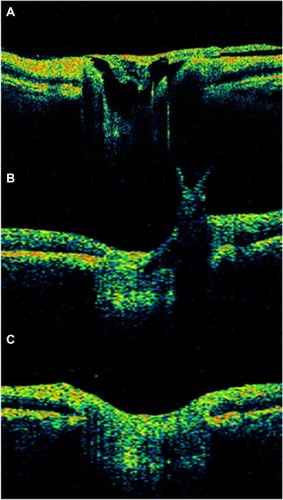
Figure 39 Cirrus™ optical coherence tomography.
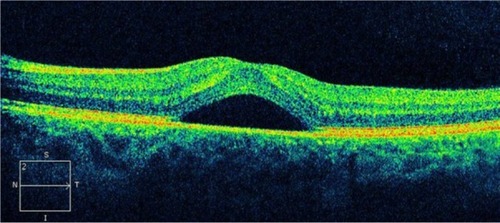
Figure 40 Central serous chorioretinopathy.
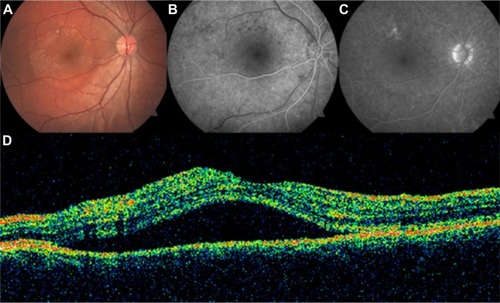
Figure 41 Central serous chorioretinopathy.
Abbreviation: OCT, optical coherence tomography.
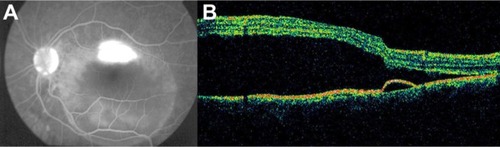
Figure 42 Central serous chorioretinopathy.
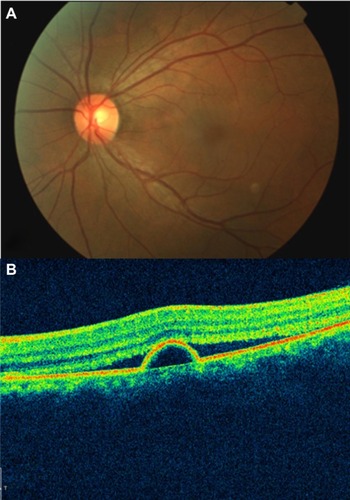
Figure 43 Central retinal artery occlusion.
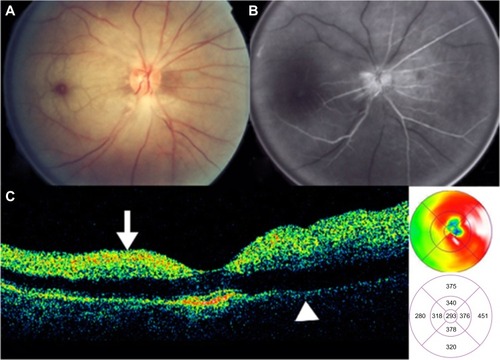
Figure 44 Branch retinal vein occlusion with macular edema.
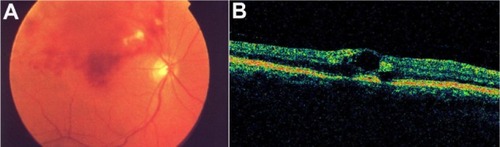
Figure 45 Central retinal vein occlusion with macular edema.
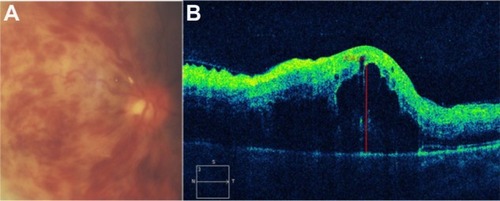
Figure 46 Acute central retinal vein occlusion with macular edema.
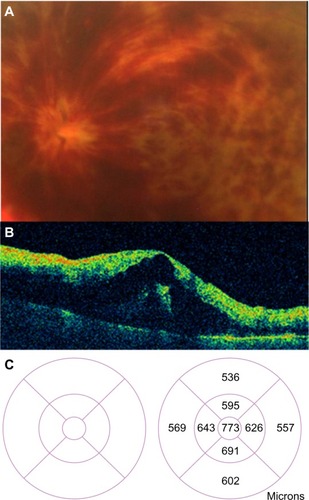
Figure 47 (A) Acute branch retinal vein occlusion with macular edema: the horizontal Stratus optical coherence tomography scan showed numerous hyporeflective spaces within the outer plexiform layer; intraretinal thickening leads to a loss of foveal contour. (B) A decrease of central macular thickness was observed 1 week after intravitreal bevacizumab therapy. (C) A normal macular thickness was seen 2 months after initial therapy.
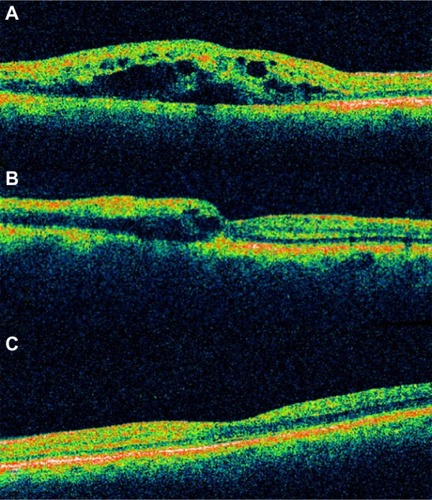
Figure 48 Myopic degeneration with retinoschisis.
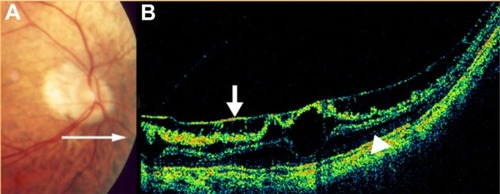
Figure 49 (A) Histological cross section of CME. (B) SD-OCT cross section of pseudophakic CME with retinal thickening, cystic intraretinal, and subretinal fluid.
Abbreviations: CME, cystoid macular edema; OCT, optical coherence tomography; SD, spectral domain.
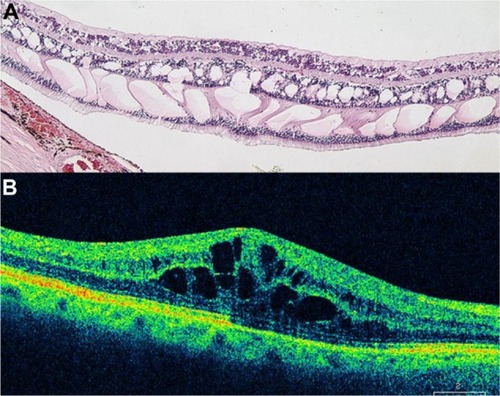
Figure 50 (A) Fluorescein angiography of CME in the recirculation phase of the angiogram demonstrates a classic petaloid leakage pattern of pseudophakic CME. (B) Cirrus™ optical coherence tomography demonstrates cystic macular changes as low-reflective spaces (dark spaces), more prominently at the level of the outer retinal layers.
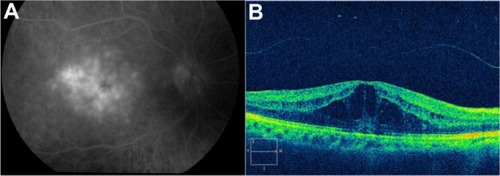
Figure 51 Sequential Stratus OCT images from a 64-year-old man with a 4-month history of loss of vision, to 20/160, in his right eye, in whom refractory pseudophakic cystoid macular edema had developed.
Abbreviations: OCT, optical coherence tomography; VA, visual acuity.
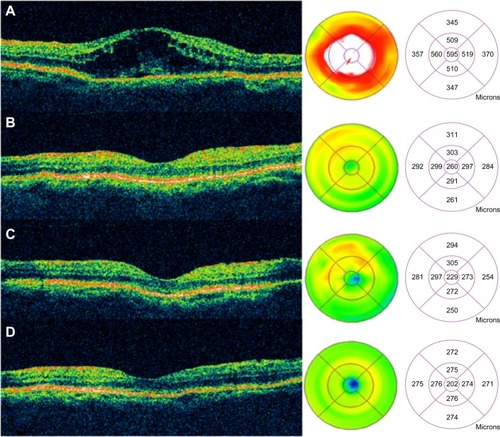
Figure 52 (A) Color fundus photograph of localized parafoveal telangiectasis. (B) Cirrus™ optical coherence tomography image shows an intraretinal cyst as a low-reflective intraretinal area, secondary to the parafoveal telangiectasis.
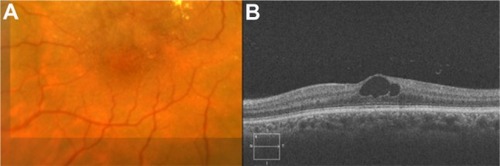
Figure 53 (A) Color fundus photograph of localized parafoveal telangiectasis. (B–D) Fluorescein angiography shows hyperfluorescence (D) due to late extravasation of the fluorescein dye. (E) The Cirrus™ optical coherence tomography image shows a intraretinal cyst as a low-reflective intraretinal area, secondary to parafoveal telangiectasis.
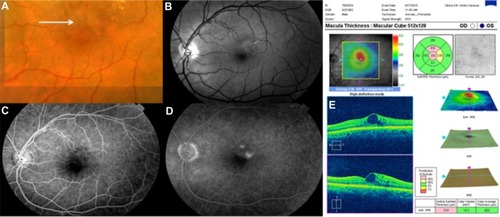
Figure 54 Fluorescein angiograms of the right (A) and left (B) eyes of a patient with hydroxychloroquine maculopathy. (C–D) Spectral domain Cirrus™ optical coherence tomography scans of the same two eyes.
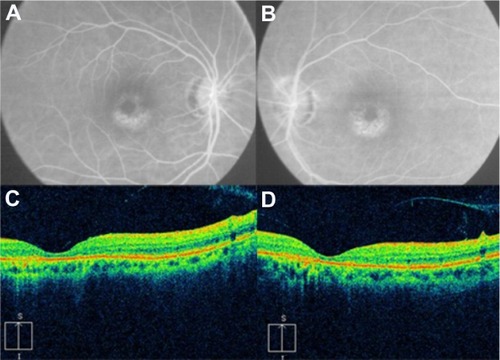
Figure 55 (A and C) Color fundus photograph and fluorescein angiogram of the right eye demonstrate papilledema, subhyaloid and retinal hemorrhages, and extensive peripapillary lipid exudation in the posterior pole, secondary to radiation retinopathy. (B and D) Spectral domain optical Cirrus™ coherence tomography image of the same eye, with noticeably increased nasal retinal thickness and hard exudates in the inner nuclear layer, outer plexiform layer, and outer nuclear layer.
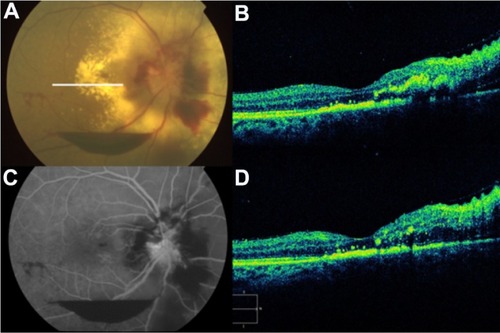
Figure 56 (A) Color fundus photograph, (B) fluorescein angiogram, (C) B-scan ultrasound, and (D) Cirrus™ optical coherence tomography image demonstrate commotio retinae and an intraocular foreign body.
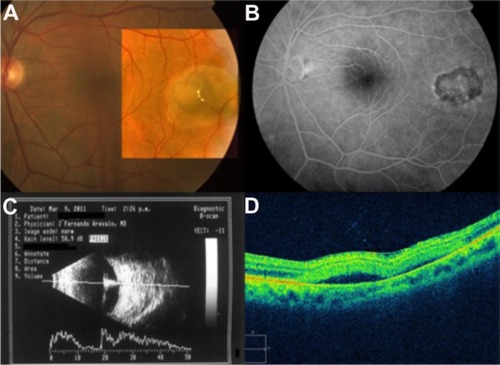
Figure 57 (A) Color fundus photograph of a retinochoroidal coloboma. (B) Normal foveal contour. (C) Cirrus™ optical coherence tomography shows the typical features of retinochoroidal coloboma with the lack of retinal and choroidal tissues, and light backscatter.
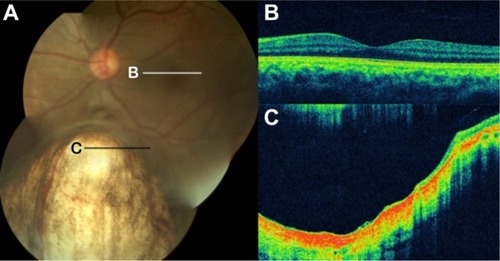
Figure 58 Foveal hypoplasia in albinism.
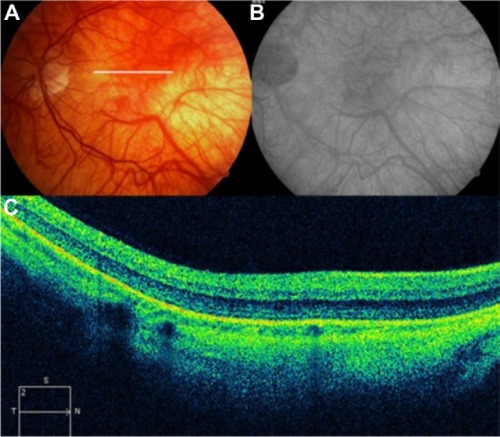
Figure 59 (A and B) Fundus color photographs of both eyes show scattered preretinal hemorrhages at the macula and surrounding the optic disk, secondary to medullary aplasia. (C) The Cirrus™ OCT image shows increased thickness and reflectivity due to the presence of blood over the inner retinal layers, causing shadowing of the optical signals of the outer retinal layers and the retinal pigment epithelium/choriocapillaris complex.
Abbreviation: OCT, optical coherence tomography.
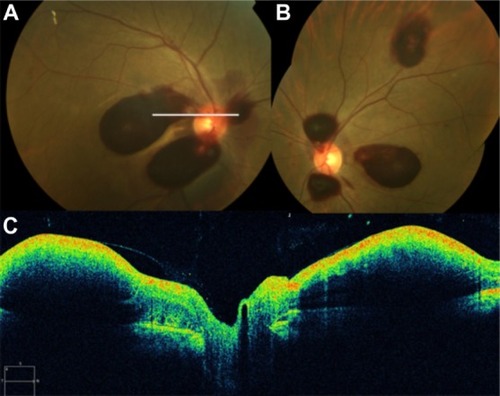
Figure 60 (A) Fluorescein angiography shows leakage from the aneurysm and surrounding area that is blocked by preretinal and retinal hemorrhage. (B) Spectral-domain Cirrus™ optical coherence tomography showing an active retinal arterial macroaneurysm.
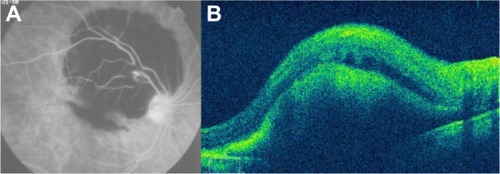
Figure 61 (A) Fundus color photograph shows retinal arterial macroaneurysm and surrounding lipid deposits 1 month after presentation. (B) Cirrus™ optical coherence tomography image shows the retinal arterial macroaneurysm located in the superficial layers and accompanied by multiple lipid deposits, predominantly seen in the outer plexiform layer.
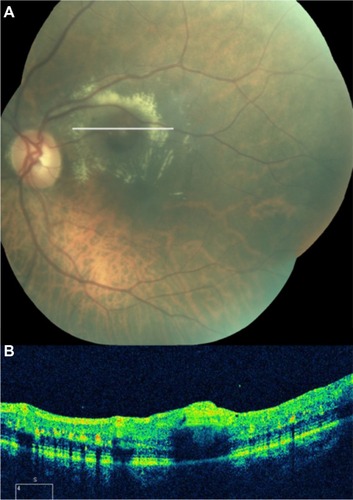
Figure 62 Coats’ disease.
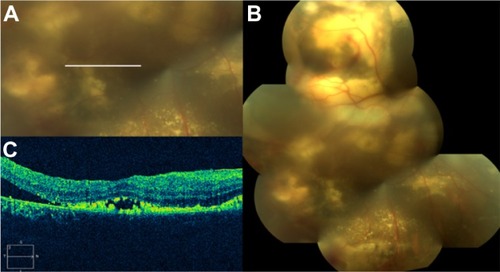
Figure 63 Spectral-domain Cirrus™ optical coherence tomography image demonstrates the presence of two subretinal bubbles of perfluorocarbon liquid (white arrows) after vitreoretinal surgery.
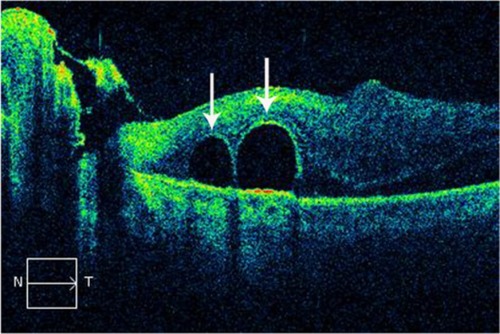
Figure 64 Spectralis® optical coherence tomography image (Courtesy of Roberto Gallego-Pinazo, MD).
Abbreviation: EDI OCT, enhanced depth imaging optical coherence tomography.
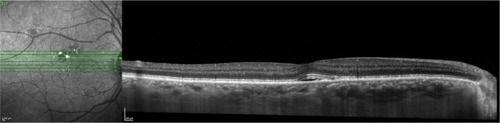
Figure 65 Spectralis® optical coherence tomography image (Courtesy of Roberto Gallego-Pinazo, MD).
Abbreviation: EDI OCT, enhanced depth imaging optical coherence tomography.