Figures & data
Table 1 Baseline characteristics
Figure 1 Spectral domain optical coherence tomography image of the left eye (A) before and (B) after phacoemulsification.
Note: N-T is from nasal to temporal; I-S is from inferior to superior.
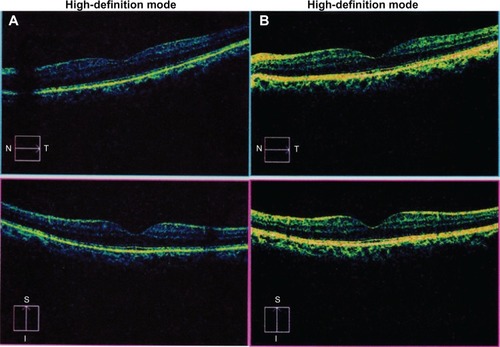
Table 2 Preoperative and postoperative macular thickness and volume after phacoemulsification
Table 3 Correlation of phacoemulsification time and structural changes in the macula
Table 4 Preoperative and postoperative visual acuity and intraocular pressure after phacoemulsification