Figures & data
Figure 1 Rim area.
Note: Bland–Altman plot of the 80 eyes with automated and manual disc margin determination.
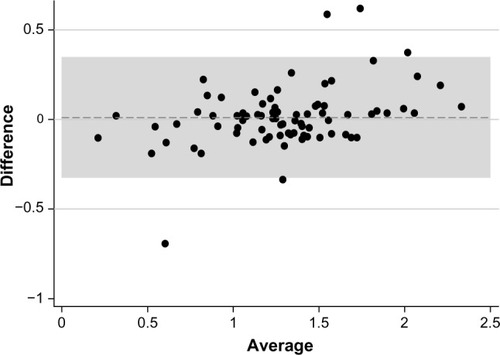
Figure 2 Cup area.
Note: Bland–Altman plot of the 80 eyes with automated and manual disc margin determination.
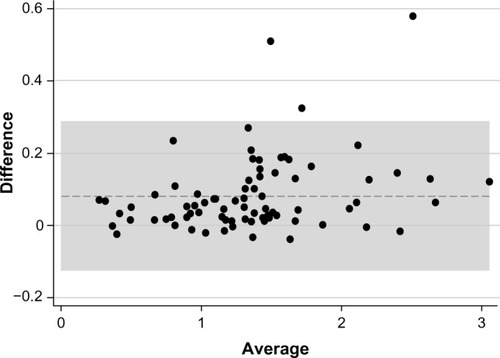
Figure 3 Cup/disc area ratio.
Note: Bland–Altman plot of the 80 eyes with automated and manual disc margin determination.
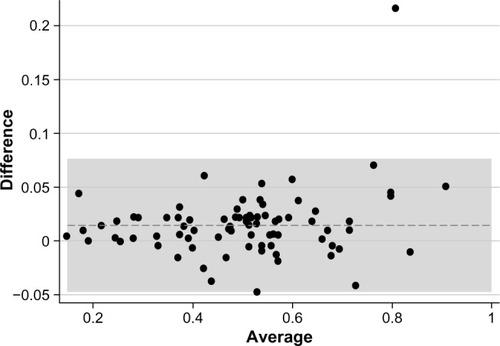
Figure 4 Disc area.
Note: Bland–Altman plot of the 80 eyes with automated and manual disc margin determination.
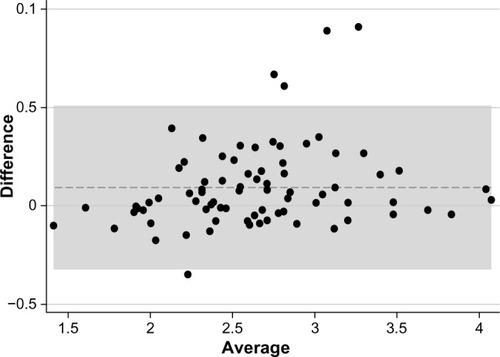
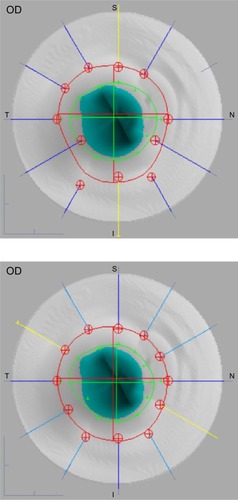
Figure 5 Optical coherence tomography optic nerve head images with automatic (top) and manual (bottom) delimitation.
Abbreviation: OD, oculus dexter (right eye).