
Figures & data
Figure 1 IOP before and after travoprost with sofZia® administration.
Notes: IOP is presented as the mean ± SD. *P<0.0001 for significant change of IOP compared with baseline by repeated measures analysis of variance and multiple comparison using Tukey’s HSD test. sofZia® (Travatan® 0.004%, Alcon Laboratories, Inc., Fort Worth, TX, USA).
Abbreviations: HSD, honestly significant difference; IOP, intraocular pressure; SD, standard deviation.
Abbreviations: HSD, honestly significant difference; IOP, intraocular pressure; SD, standard deviation.
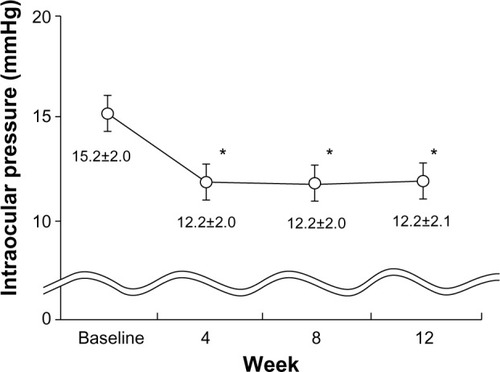
Figure 2 Percentage reduction of IOP with drug administration.
Notes: IOP reduction rates are classified into four categories represented by each column:
 ≥30%,
≥30%,
 ≥20%,
≥20%,
 ≥10%,
≥10%,
 <10%. Open circle (
 ) represents the mean ± SD. Vertical axes: Left and right axes represent cumulative and average percentage reduction of IOP, respectively.
Abbreviations: IOP, intraocular pressure; SD, standard deviation.
Abbreviations: IOP, intraocular pressure; SD, standard deviation.
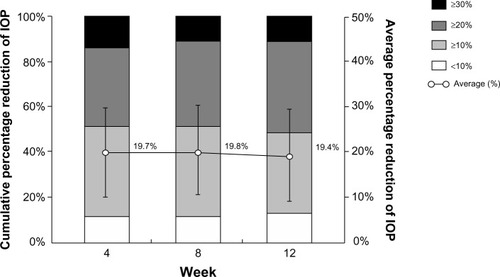
Figure 3 Change of IOP in three groups with drug administration.
Notes: Eyes were classified into three groups based on their baseline IOP: ○ ≥17 mmHg, ● ≥14 mmHg and 17 mmHg, × <14 mmHg. *P<0.0001 for significant change of IOP compared with each baseline by repeated measures analysis of variance and multiple comparison using Tukey’s HSD test.
Abbreviations: HSD, honestly significant difference; IOP, Intraocular pressure.
Abbreviations: HSD, honestly significant difference; IOP, Intraocular pressure.
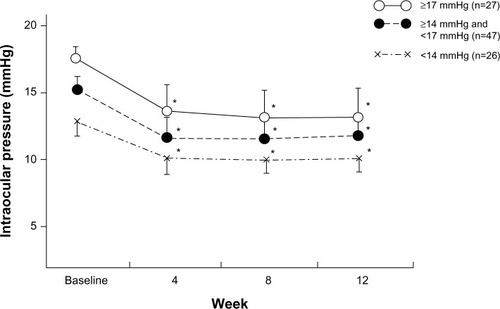
Table 1 SPK and hyperemia scores
Figure 4 Cumulative incidence of subjective symptoms.
Notes: The cumulative incidence of adverse events in this study was 40.8% (by week 12). The most frequently observed event was ocular irritation [○: 26.2%, n=27], itching (●: 18.5%, n=19), foreign body sensation (×: 17.5%, n=18) and dryness (∆: 4.9%, n=5).
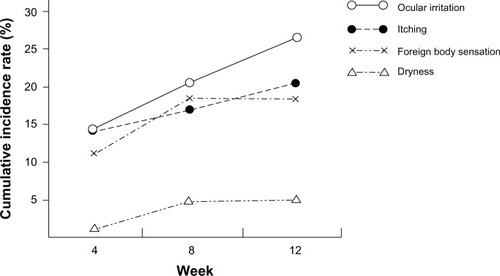
Table S1 IOP CHecked and Assessed in Normal tension Glaucoma by Exceptional Glaucomatologists (CHANGE) Study Group