
Figures & data
Figure 1 A flight of stairs viewed through a left, plano + 4D power progressive lens.
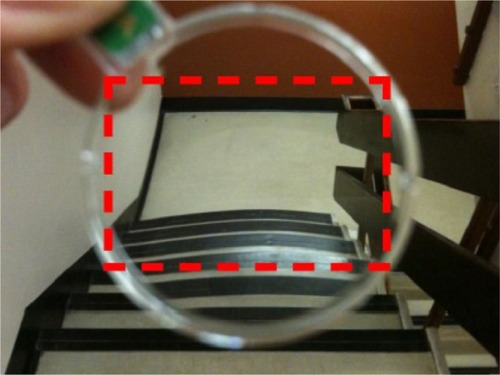
Figure 2 Vertical prismatic displacement measured by the focimeter.
Abbreviation: PAL, progressive addition lens.
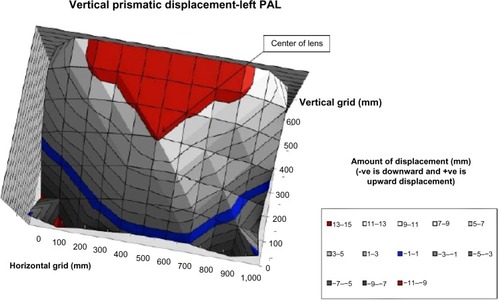
Figure 3 Horizontal prismatic displacement measured by the focimeter.
Abbreviation: PAL, progressive addition lens.
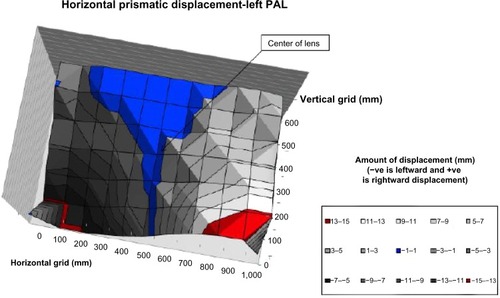
Figure 4 A diagram that represents the equipment used to measure accuracy.
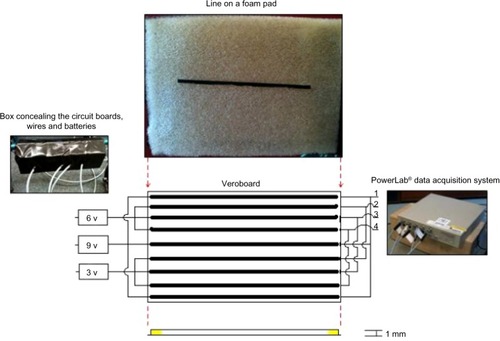
Figure 5 LabChart® display window.
Abbreviation: v, voltage.
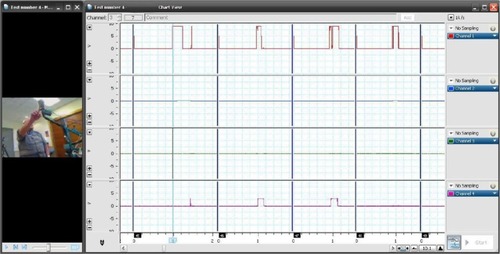
Figure 6 Diagram illustrating the Mobilis® Quad walking frame in the center and the three major components attached to the frame.
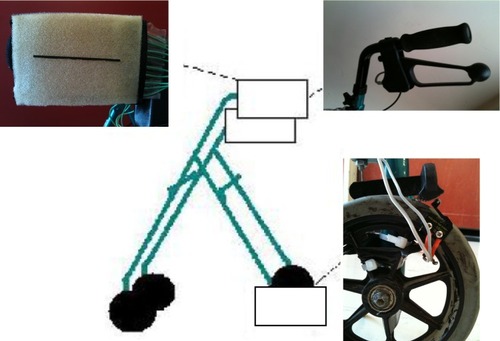
Figure 7 Participant recruitment.
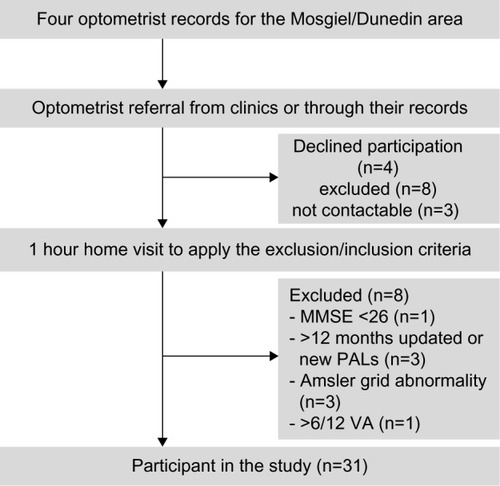
Table 1 Characteristics of participants (n=31), where values are numbers (percentages) unless otherwise stated
Figure 8 Reaction time measurements for grasping a bar at the various points of fixation while wearing the two glasses.
Abbreviation: PALs, progressive addition lenses; R, right; s, second.
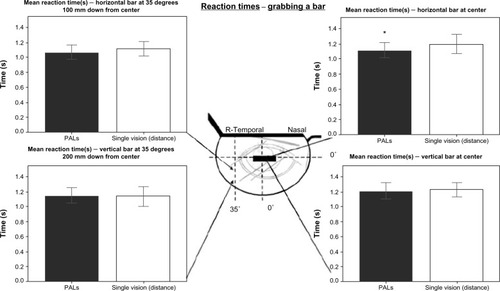
Figure 9 Reaction time measurements for pushing a black line at the various points of fixation while wearing the two glasses.
Abbreviations: PALs, progressive addition lenses; T, temporal; N, nasal.
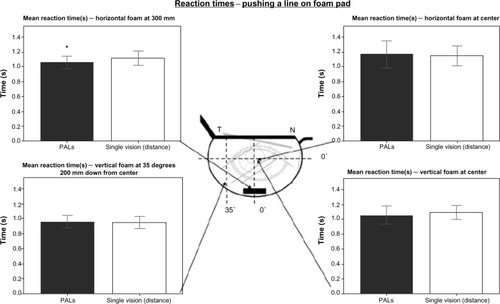
Table 2 Reaction times (seconds) for reaching the targets and the difference in displacement between the two glasses (millimeters) at each position tested
Figure 10 The pie graphs represent accuracy of the participant when pushing the black line on a foam pad at the various points of fixation.
Abbreviations: PALs, progressive addition lenses; T, temporal; N, nasal.
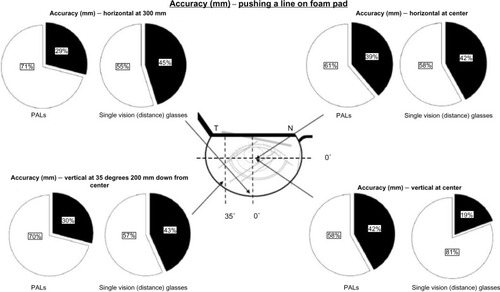
Table 3 Accuracy measurements in binomial distribution for each of the positions tested