
Figures & data
Figure 1 GTS400 iStent inject® and G2-M-IS injector.
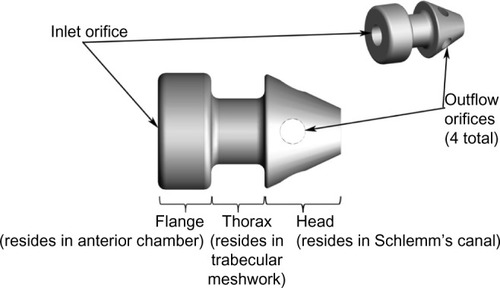
Figure 2 G2-M-IS injector.
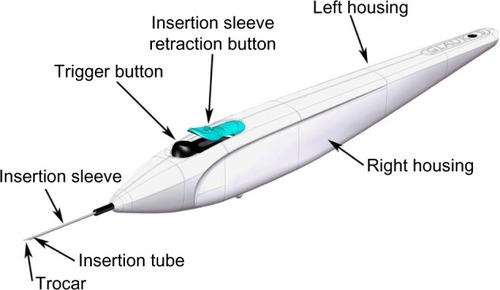
Table 1 Subject accountability
Table 2 Demographics
Figure 3 Proportion of eyes with an M12 IOP reduction ≥50%, ≥40%, ≥30%, and ≥20%, respectively, for the iStent inject eyes without medication versus the two medications group, with a nonresponder assumption for missing data. A between-group difference was significant (P=0.02) at the ≥50% level of IOP reduction.
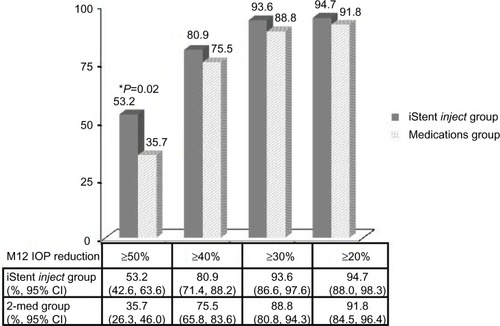
Figure 4 Proportion of eyes with an M12 IOP ≤15 mmHg and ≤18 mmHg, respectively, for the iStent inject eyes without medication versus the two-medications group, with a nonresponder assumption for missing data.
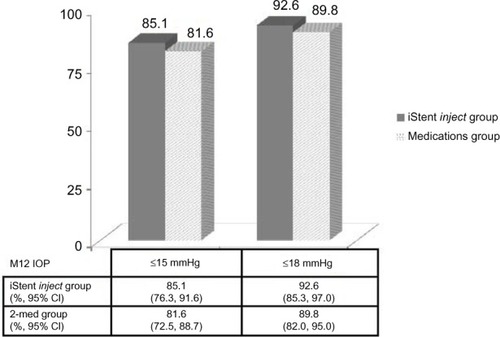
Table 3 Mean intraocular pressure and intraocular pressure change by visit – all eyes
Table 4 Vertical cup-to-disc ratio change from baseline
Table 5 Ocular adverse events and other postoperative observations