
Figures & data
Table 1 Patient data summary
Table 2 Comparison of patient demographics, ocular characteristics, and surgical procedures, between patients with graft rejection and without rejection
Figure 1 The Kaplan–Meier curves for overall corneal allograft survival.
Notes: Eight out of eleven grafts (72.7%) underwent rejection during the mean follow-up period of 687±309 days. The mean survival time of the grafts was 391±124 days.
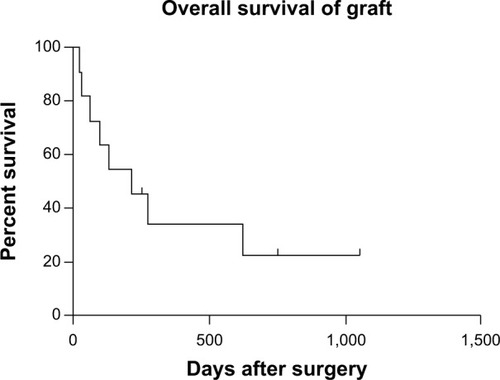
Figure 2 Comparison of Kaplan–Meier curves for the analysis of factors affecting corneal allograft survival.
Notes: The survival rates of corneal grafts were compared depending on the presence of inflammation or neovascularization of the cornea (A and B), the presence of retinal detachment (C), intravitreal gas or silicone oil injection (D and E), or previous history of corneal grafts (F).
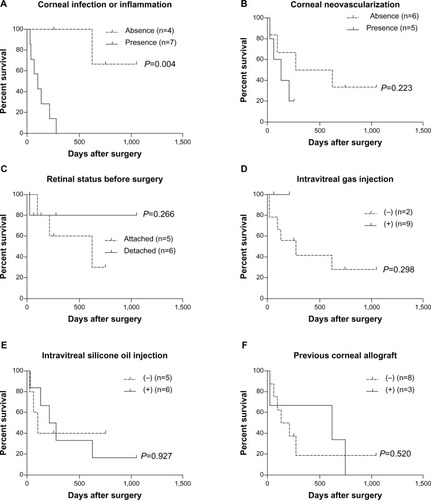
Table 3 Analysis for factors affecting the survival time of corneal allografts