Figures & data
Figure 1 Fixation recording in a patient with oculocutaneous albinism collected using a 30 Hz eye tracker.
Notes: Plotted using MATLAB programming provided open source by the Daroff-Dell’Osso Ocular Motility Laboratory (http://www.omlab.org/software/software.html). Figure courtesy of Mark Bolding, PhD.
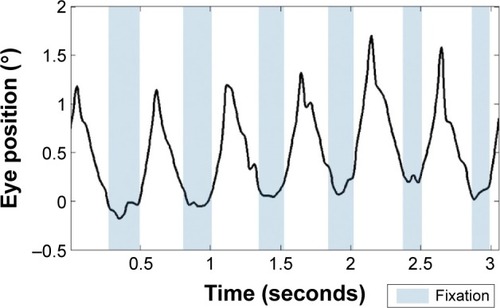
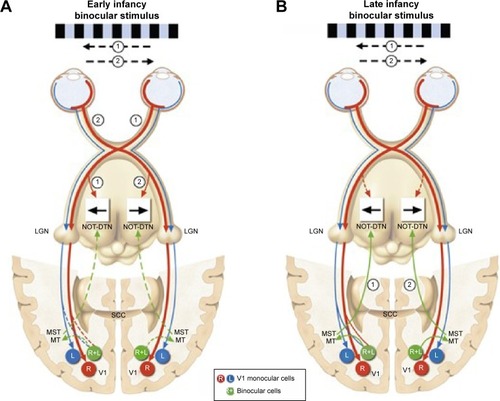
Figure 2 Depiction of the brain, as viewed from above, showing normal cortical and subcortical projections during early human development.
Notes: (A) Early in infancy, horizontal optokinetic stimuli (shown as leftward or rightward motion) from each nasal retina are transmitted via a subcortical pathway to the contralateral nucleus of the optic tract-dorsal terminal nucleus (NOT-DTN) of the accessory optic system (solid red arrow), which is directionally sensitive to ipsiversive motion (ie, nasalward for the contralateral eye). During this early stage of development, the cortical pursuit pathways (shown as corticofugal projection from the middle temporal area–medial superior temporal area [MT-MST] to the ipsilateral NOT-DTN) have not yet become functional (interrupted green arrows). (B) Later in infancy, horizontal optokinetic responses become encephalized, binocular cortical pursuit pathways become fully operational (solid green arrows), and subcortical optokinetic pathways regress (interrupted red arrows). Reproduced from Brodsky MC, Dell’Osso LF. A unifying neurologic mechanism for infantile nystagmus. JAMA Ophthalmol. 2014;132(6):761–768.Citation1 Copyright © (2014) American Medical Association. All rights reserved.
Abbreviations: L, left eye monocular cells; LGN, lateral geniculate nucleus; R, right eye monocular cells; R+L, cortical binocular cells; SCC, splenium of the corpus callosum; V1, primary visual cortex.
Abbreviations: L, left eye monocular cells; LGN, lateral geniculate nucleus; R, right eye monocular cells; R+L, cortical binocular cells; SCC, splenium of the corpus callosum; V1, primary visual cortex.