
Figures & data
Figure 1 Patient disposition.
Notes:
aThe 227 randomized patients represented the safety population, which included all patients who received at least one dose of study medication. bITT population (efficacy analysis population) included all patients with baseline visit assessment who received at least one dose of study medication and at least one on-therapy efficacy assessment. Missing data were treated by last observation carried forward. cPP population included patients with at least one on-therapy efficacy assessment and no major protocol violation.
Abbreviations: ITT, intent to treat; PP, per protocol; N/n, number.
Abbreviations: ITT, intent to treat; PP, per protocol; N/n, number.
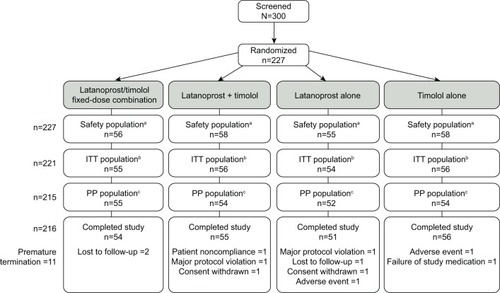
Table 1 Patient demographic and baseline characteristics (ITT population)Table Footnote*
Figure 2 Mean IOP at each time point by visit.
Notes: Mean IOP is the mean per treatment group at each time point at each visit (day 7±1, 14±2, 28±2, and 42±2) during the 6-week treatment period. Data shown are from the efficacy analysis (ITT) population. P-value was calculated using a paired Student’s t-test for comparing mean value from baseline (day 0) to mean value for week 1 (day 0 to day 7±1), week 2 (day 0 to day 14±2), week 4 (day 0 to day 28±2), and week 6 (day 0 to day 42±2) for each treatment group.
Abbreviations: IOP, intraocular pressure; ITT, intent to treat.
Abbreviations: IOP, intraocular pressure; ITT, intent to treat.
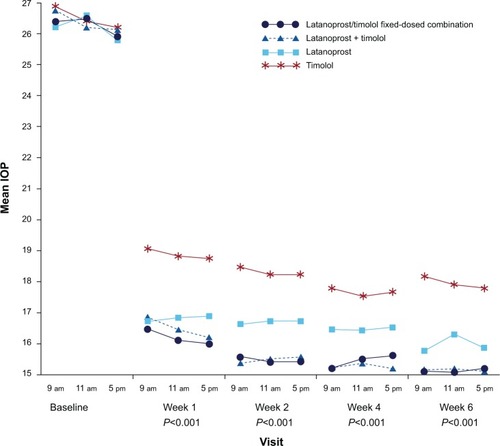
Table 2 IOP change from baseline at each time point during 6 weeks of treatment with a fixed-dose combination of latanoprost/timolol, concomitant latanoprost + timolol, latanoprost alone, and timolol alone
Figure 3 Responder rates (defined as patients having IOP ≤18 mmHg for at least two time points at each follow-up visit) for the four treatment groups.
Notes:
P-values were calculated using chi-square test for comparing treatment groups (each treatment group versus latanoprost/timolol fixed-dose combination group). Data shown are from the efficacy analysis (ITT) population. *indicates a statistically significant P-value.
Abbreviations: IOP, intraocular pressure; ITT, intent to treat.
Abbreviations: IOP, intraocular pressure; ITT, intent to treat.
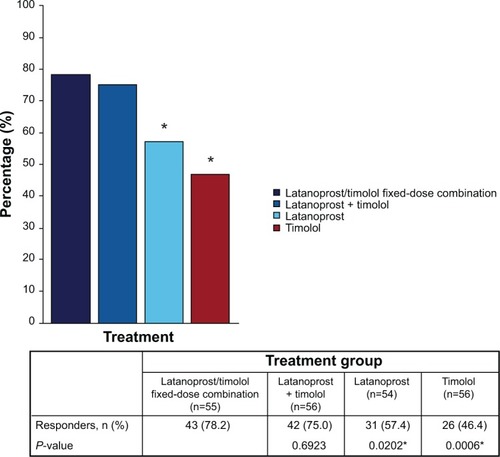
Table 3 Summary of ocular TEAEs reported during the course of the study (safety population)
Table 4 Summary of nonocular TEAEs reported during the course of the study (safety population)