Figures & data
Figure 1 Fundus color photographs of the right and left eye of a patient with advanced choroideremia.
Note: There is a residual island of healthy tissue in the central macula and fovea (white arrows).
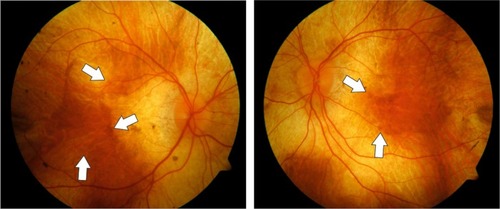
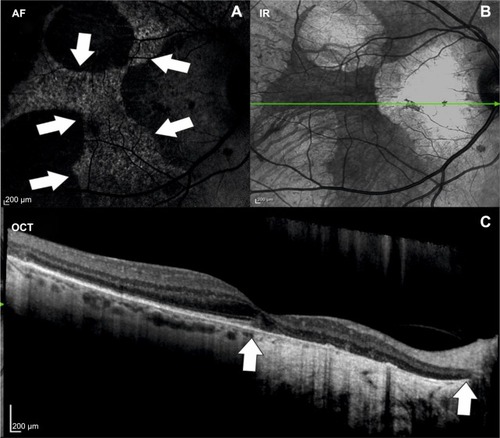
Figure 2 Multimodal imaging of a patient with choroideremia.
Notes: (A) Fundus AF showing an island of hyperfluorescent intact retina (delineated by white arrows). (B) IR image with corresponding OCT scan line (the green line represents the OCT scan direction) and (C) OCT images of the same patient. In OCT, the marked atrophy of the retinal pigment epithelium with homogenously increased reflectivity in OCT corresponds well with the borders seen in AF. There is a marked thinning of the outer nuclear layers and the choroidea is virtually absent, both hallmarks of choroideremia.
Abbreviations: AF, autofluorescence; OCT, optical coherence tomography; IR, infrared.
Abbreviations: AF, autofluorescence; OCT, optical coherence tomography; IR, infrared.