Figures & data
Table 1 Summary of cases with hypotony maculopathy treated with vitreoretinal surgery
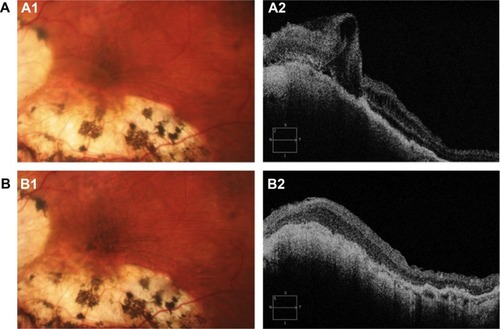
Figure 1 (A) Preoperative hypotony maculopathy shown by posterior pole biomicroscopy (A1) and by optical coherence tomography (A2) in case 1. (B) Biomicroscopy (B1) and optical coherence tomography obtained one year after vitreoretinal surgery (B2) in case 1. Note the increase of hyperpigmentation (B1) despite resolution of the retinal folds, but not the choroidal folds (B2) in case 1.