Figures & data
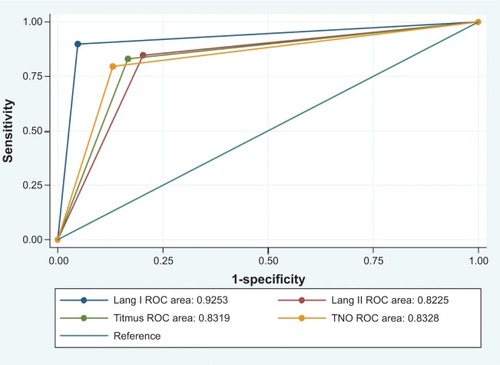
Figure 1 Stereo tests results showing the sensitivity, specificity, and positive and negative predictive values for strabismus expressed in percentages.
Abbreviations: NPV, negative predictive value; PPV, positive predictive value.
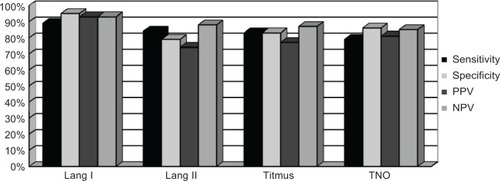
Table 1 Stereo tests results showing the sensitivity, specificity, and PPVs and NPVs with 95% CI
Figure 2 Stereo test receiver operating characteristic (ROC) curve and area under ROC curve.
Notes: Shows all details of the ROC analysis results. The Lang I stereo test discloses the major AUC (area under ROC curve) of 0.92, compared to the Lang II (0.82), Titmus and TNO testing (0.83). All results appeared statistically significant (P=0.0001).