
Figures & data
Figure 1 The survival curve demonstrates the surgical success of both groups during the follow-up period of 24 months.
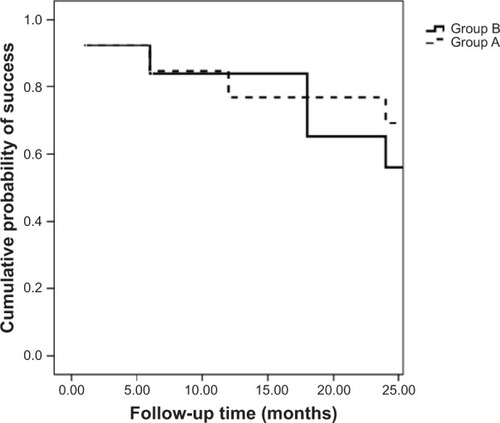
Table 1 Surgical success and numbers in each study group analyzed at each follow-up point at 1, 6, 12, 18, and 24 months postoperatively
Figure 2 Scatter plots illustrating the proportions of study participants in both groups who meet the criteria for success at 12 months.
Abbreviation: IOP, intraocular pressure.
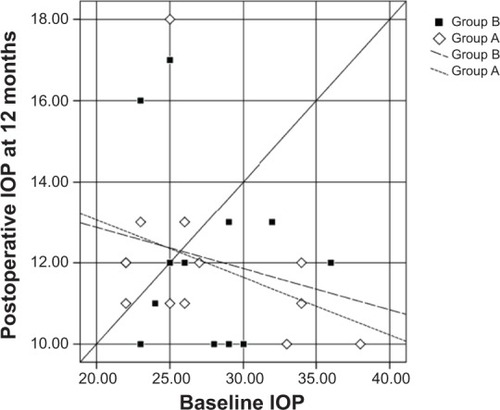
Figure 3 Scatter plots illustrating the proportions of study participants in both groups who meet the criteria for success at 18 months.
Abbreviation: IOP, intraocular pressure.
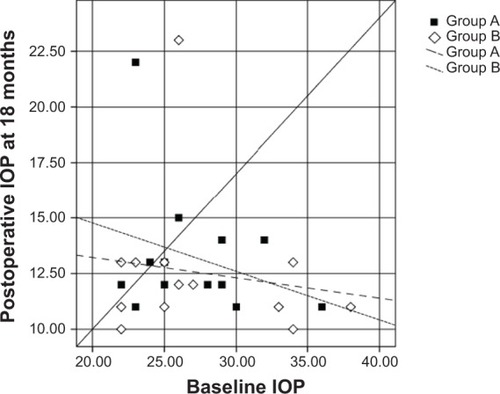
Figure 4 Scatter plots illustrating the proportions of study participants in both groups who meet the criteria for success at 24 months.
Abbreviation: IOP, intraocular pressure.
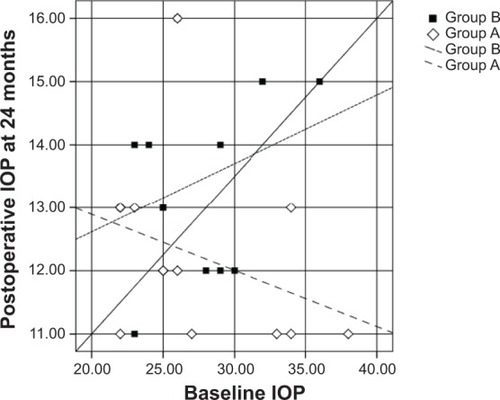
Figure 5 Mean postoperative intraocular pressure (IOP) values in both groups all during the study period.
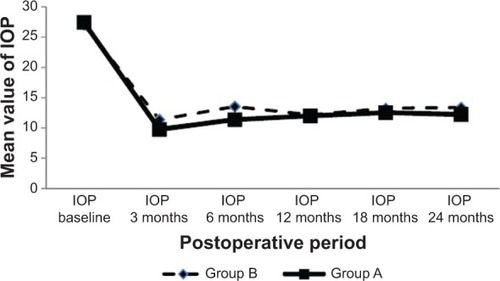
Table 2 Mean and standard deviation values of intraocular pressure in both groups during the study period
Figure 6 Percentages of patients receiving intraocular pressure-lowering drugs in both patient groups at different times of 6, 12, 18, and 24 months postoperatively.
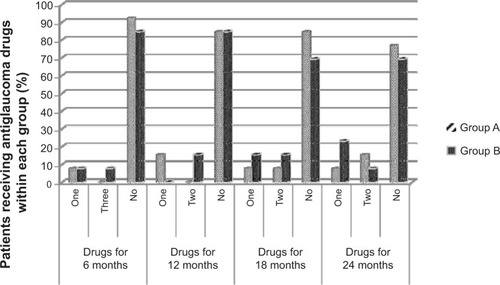
Figure 7 Functioning bleb of a group A patient (mitomycin C and bevacizumab) postoperatively.
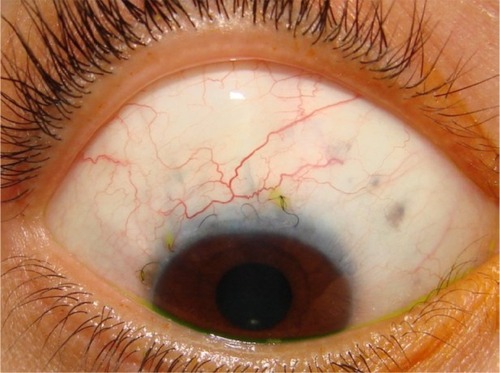
Figure 8 Functioning bleb of a group A patient (mitomycin C and bevacizumab) late postoperatively.
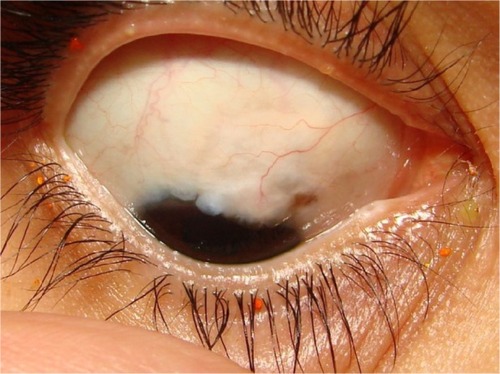
Figure 9 Functioning bleb of a group B patient (mitomycin C only) early postoperatively.
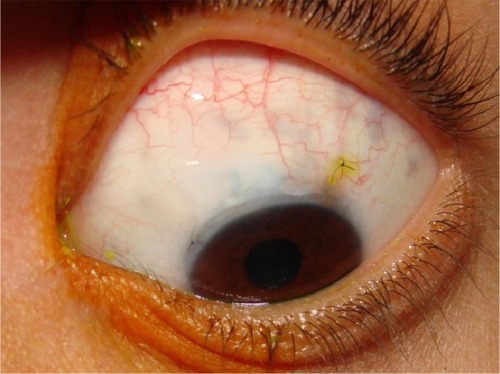
Figure 10 Functioning bleb of a group B patient (mitomycin C only) late postoperatively.
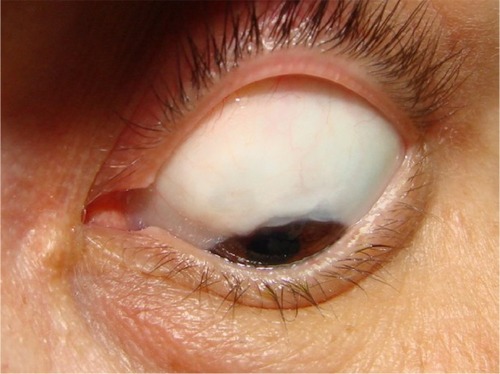
Figure 11 Patient with bilateral functioning blebs. The right eye of group A (mitomycin C and bevacizumab) and the left eye of group B (mitomycin C only).
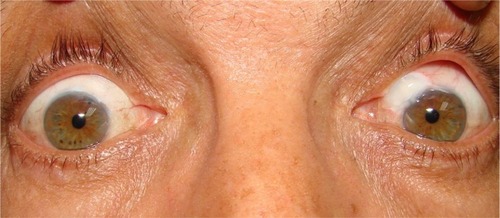
Table 3 Baseline and the postoperative values at 24 months of corrected distance visual acuity and visual field parameters (mean deviation and pattern standard deviation in decibels) in both groups
Table 4 The intraoperative and early and late postoperative complications of both groups