Figures & data
Figure 1 Central 24 degree perimetry from May 2011 showing peripheral deep defects and no defects within the 10 central degrees. Foveal threshold is zero dB (shown by oval gray line).
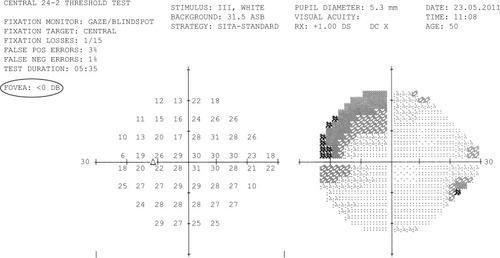
Figure 2 Central 10 degree perimetry from July 2011 revealing a small perifoveal scotoma with a sensitivity of 9 dB (indicated by the gray circle in the left numerical pattern).
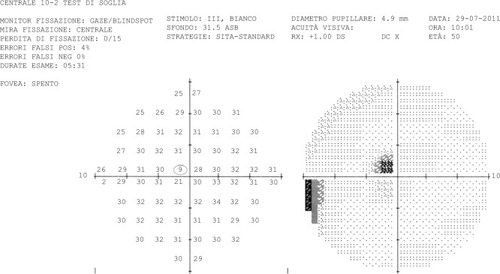
Figure 3 Central 10 degree perimetry from April 2013 showing disappearance of the previous scotoma and sensitivity improvement to 28 dB at the same point (shown by gray circle in the left numerical pattern). Foveal threshold increased to 21 dB (shown by oval gray line).
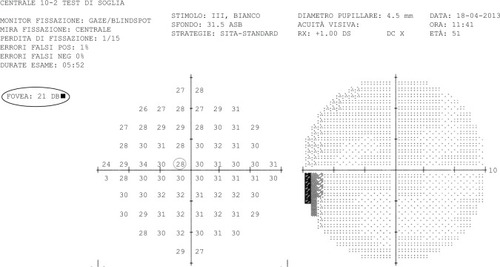
Figure 4 Fluorescein angiography showing no abnormalities.
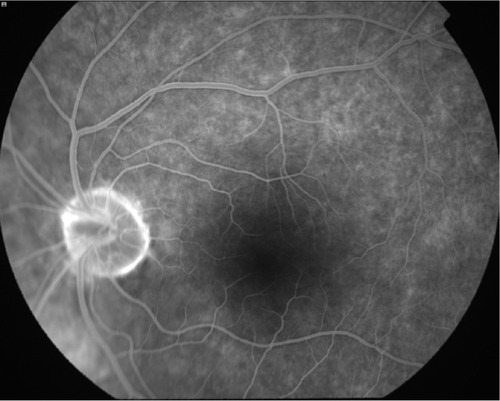
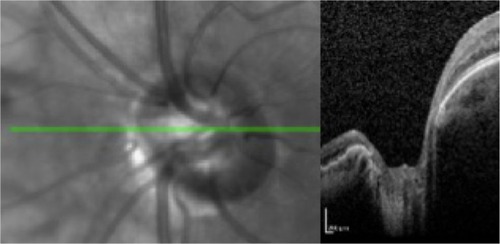
Figure 5 Associated B-scan optical coherence tomography showing normal anatomy of the macula.
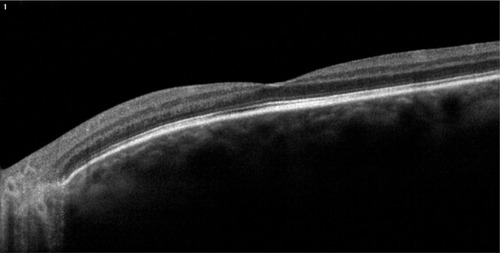
Figure 6 Associated “en-face” optical coherence tomography scan showing a small shiny gray–white area adjacent to the foveal depression at the level of the inner limiting membrane (marked by red arrow).
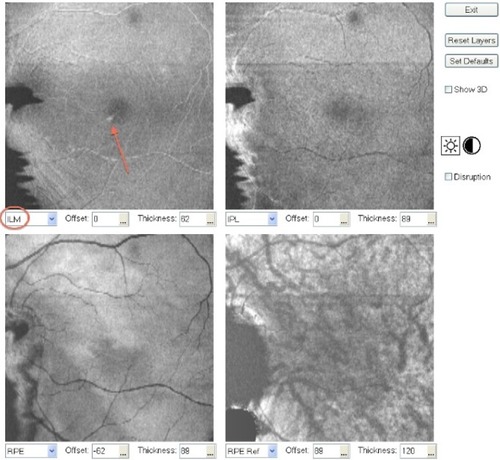
Figure 7 Color fundus enhanced photograph showing the same image observed in the “en-face scan” optical coherence tomography (marked by pink arrow).
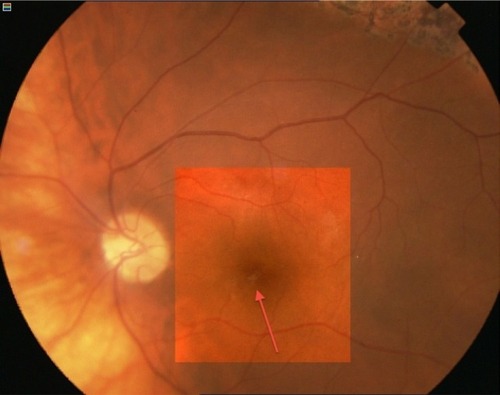
Figure 8 Dense B-scan optical coherence tomograph through the whitish area showing no abnormalities.
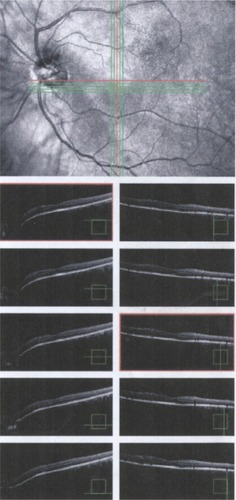
Figure 9 B-scan optical coherence tomographic image through the optic disc showing no silicone oil trapped.