Figures & data
Figure 1 Anterior-segment optical coherency high-resolution cross-sectional (6 mm) image of an eye treated with LASIK-CXL for −2.25 D of sphere and −0.25 D of astigmatism, obtained 1-year postoperatively. Blue arrows indicate the LASIK flap, while yellow arrows indicate the stromal hyper-reflection line, which correlates with the depth of the prophylactic cross-linking effect.
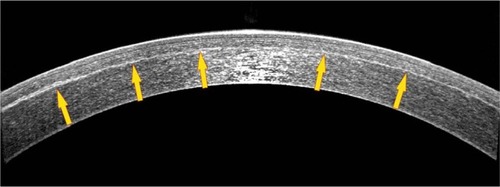
Table 1 Preoperative demographics, including the planned residual stromal thickness, between the two groups
Figure 2 Postoperative uncorrected distance visual acuity (blue columns) versus preoperative corrected distance visual acuity (red columns) 1-year postoperatively, in (A) the LASIK-CXL group and (B) the stand-alone LASIK group.
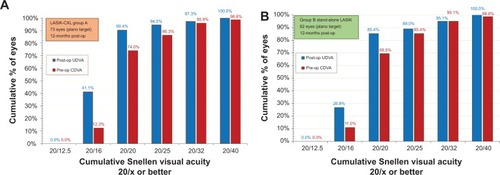
Figure 3 Change in corrected visual acuity, as a percentage of eyes with gain/loss in Snellen lines of corrected distance visual acuity 1-year postoperatively.
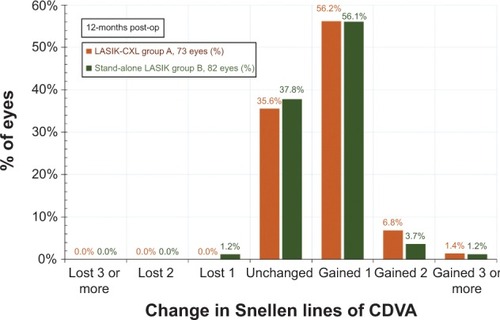
Figure 4 Predictability of spherical equivalent correction, measured at 1-year postoperatively, showing achieved spherical equivalent (vertical axis) versus attempted spherical equivalent (horizontal axis), in (A) the LASIK-CXL group and (B) the stand-alone LASIK group.
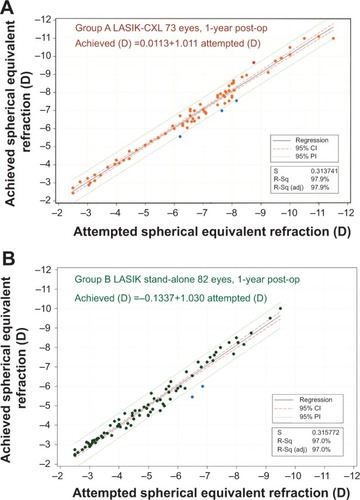
Figure 5 Postoperative spherical equivalent refraction for both groups, 1-year postoperatively.
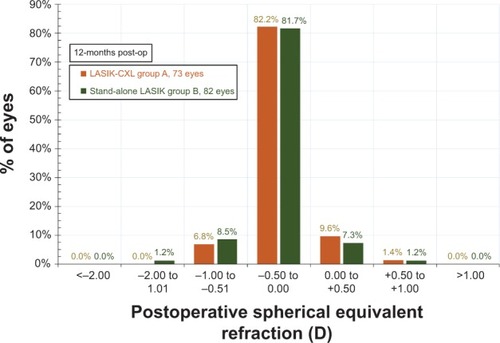
Figure 6 Refractive astigmatism preoperatively (red columns) and 1-year postoperatively (blue columns), in (A) the LASIK-CXL group and (B) the stand-alone LASIK group.
Abbreviations: CXL, cross-linking; LASIK, laser-assisted in situ keratomileusis.
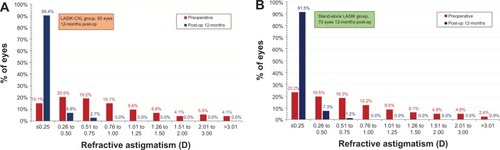
Figure 7 Stability of manifest spherical equivalent refraction for both groups, expressed in diopters (D), up to 1-year postoperatively.
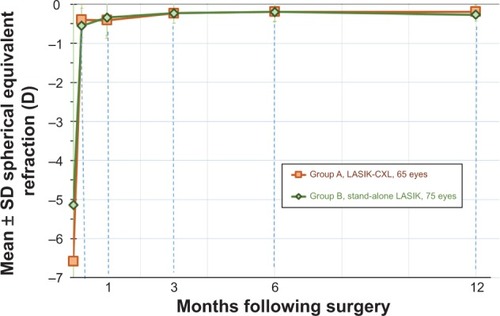
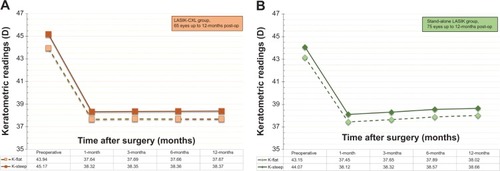
Figure 8 Stability of corneal keratometry for (A) the LASIK-CXL group and (B) the stand-alone LASIK group, expressed in diopters (D), up to 1-year postoperatively.