
Figures & data
Table 1 Clinical profile of the subjects
Figure 1 IOP at baseline and at each time after switching to the DTFC.
Abbreviations: DTFC, dorzolamide/timolol (1%/0.5%) fixed combination; IOP, intraocular pressure; NTG, normal tension glaucoma; POAG, primary open-angle glaucoma.
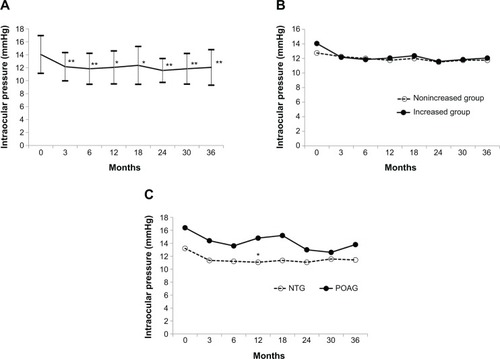
Figure 2 The mean percent reduction of IOP from baseline at each time after switching to DTFC, in all patients (A), in the nonincreased and increased groups (B), and in patients with POAG or NTG (C).
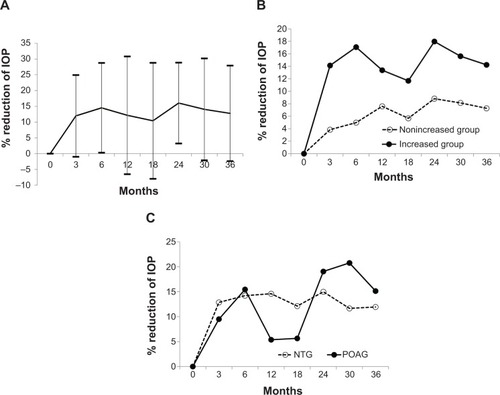
Figure 3 The correlation between the baseline IOP and percent reduction of IOP, in all patients (A), the nonincreased group (B), and the increased group (C).
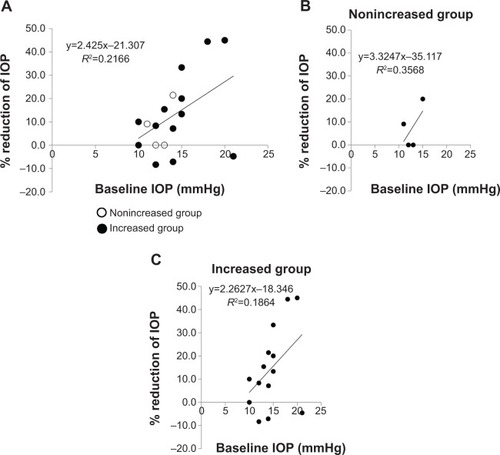
Table 2 Correlations between the IOP reduction rate and various factors, as well as multivariate odds ratios for the IOP reduction rate (n=19)
Figure 4 Kaplan–Meier cumulative probability of treatment success, in the nonincreased group vs the increased group (A) or in patients with NTG vs patients with POAG (B).
Abbreviations: BB, beta-blocker; CAI, carbonic anhydrase inhibitor; DTFC, dorzolamide/timolol (1%/0.5%) fixed combination; NTG, normal tension glaucoma; PGA, prostaglandin analog; POAG, primary open-angle glaucoma; vs, versus.
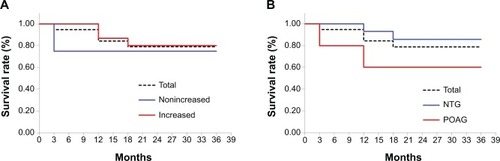
Table 3 Cox proportional hazards analysis with hazard ratios and 95% confidence intervals for predictors of IOP control after switching