
Figures & data
Figure 1 Patient flow.
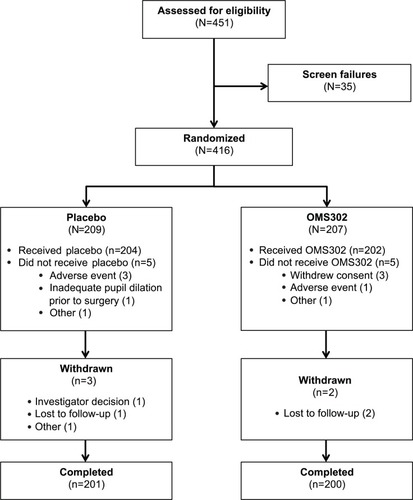
Table 1 Demographic and baseline characteristics (full analysis population set)
Figure 2 Change from baseline in mean (± SE) pupil diameter over time to the end of surgery (full analysis population set). Pupil diameters were measured at one-minute intervals from baseline to the end of the procedure and at the end of cortical clean-up from a video of patients’ intraoperative lens replacement procedures. Variability increased after 21 minutes when only nine placebo-treated patients and five OMS302-treated patients were still undergoing surgery.
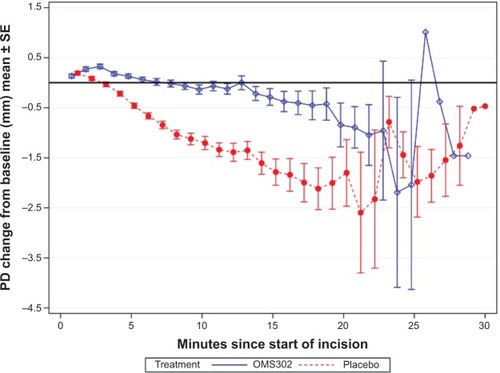
Table 2 Analysis of intraoperative changes in pupil diameter (full analysis population set)
Figure 3 Mean (± SE) VAS ocular pain scores during the early postoperative period (full analysis population set).
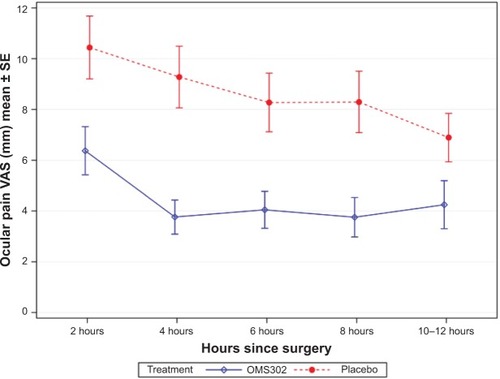
Table 3 Analysis of ocular pain VAS scores within 12 hours postoperatively (full analysis population set)
Table 4 Treatment-emergent adverse events occurring in more than 5% of patients in either treatment group (safety population)