
Figures & data
Figure 1 Corneal topographies.
Abbreviations: A–B, difference map showing change from topography A to B; B–D, difference map showing change from topography B to D; N, nasal; OS, oculus sinister (left eye); T, temporal.
Notes: (A) Pre-Supracor shows with-the-rule astigmatism. (B) 1 year post-Supracor shows the steep Supracor bump to be slightly off-center. (C) Difference map pre-Supracor versus 1 year post-Supracor shows the magnitude and area of steepening caused by supracor and change in topography from (A) to (B). (D) 6 months post-reversal shows some flattening of the Supracor bump with recentration and decrease in the corneal steepness. (E) Difference map pre-Supracor reversal versus 6 months post-reversal shows where the flattening occurred specifically in the decentered steep area and change in topography from (B) to (D).
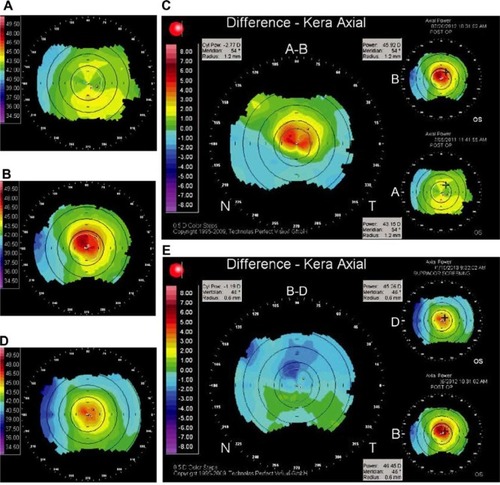
Table 1 Aberrometry data
Table 2 Pre- and post-treatment refraction and acuities