
Figures & data
Table 1 Summary of covariate data
Figure 1 Influence of sex on plasma pegaptanib levels over time.
Abbreviations: F, females; h, hour; Geo, geometric; M, males; PRED, prediction.
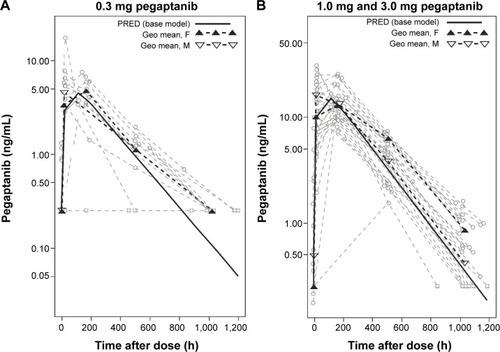
Table 2 Non-compartmental analysis parameter predictions for the final model scaled to 0.3 mg pegaptanib
Figure 2 Influence of the covariate creatinine clearance (CRCL) on plasma pegaptanib levels over time.
Abbreviations: h, hour; Geo, geometric; min, minute; PRED, prediction.
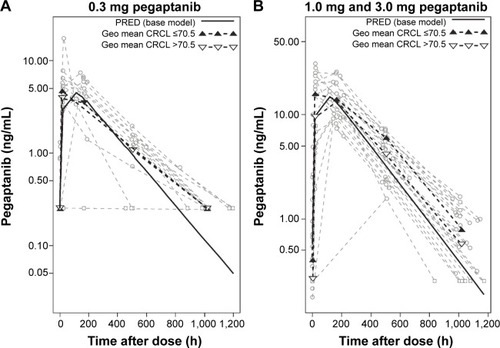
Figure 3 (A) Influence of creatinine clearance (CRCL) on the predicted pegaptanib exposure for a typical individual. The predictions are based on the final model, with η set to 0 for a typical individual. (B) The ratio of clearance (CL) for a 0.3 mg dose to the CL predicted for a patient with a CRCL of 80 mL/min. The ratio of area under the concentration–time curve (AUC) for a 0.3 mg dose to the AUC predicted for a patient with a CRCL of 80 mL/min is also shown. The 90% confidence intervals (CIs) are displayed as dashed lines in both panels. These were computed by sampling parameter estimates from a multivariate normal distribution (n=10,000) with a covariance matrix equal to the covariance matrix of the estimates from the full working model to avoid overly narrow CI ranges.
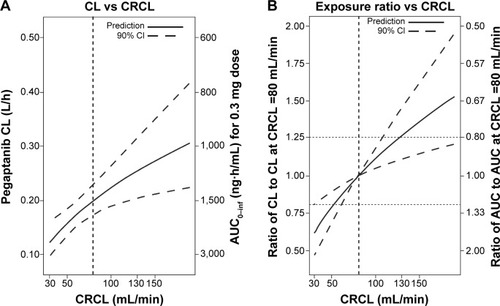
Figure 4 Clearance (CL) and area under the concentration–time curve (AUC) at creatinine clearance (CRCL) <30 mL/min predicted using two models.
Abbreviations: AUC0–inf, area under the concentration–time curve from time 0 to infinity; CI, confidence interval; h, hour; inf, infinity; IPRED, individual prediction; min, minute; PRED, prediction.
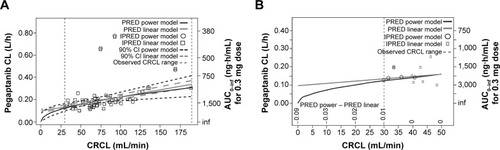
Figure 5 Forest plot summarizing the influence of diabetic macular edema on the systemic exposure to pegaptanib.
Abbreviations: CI, confidence interval; CRCL, creatinine clearance; F, female; M, male; min, minute; y, years.
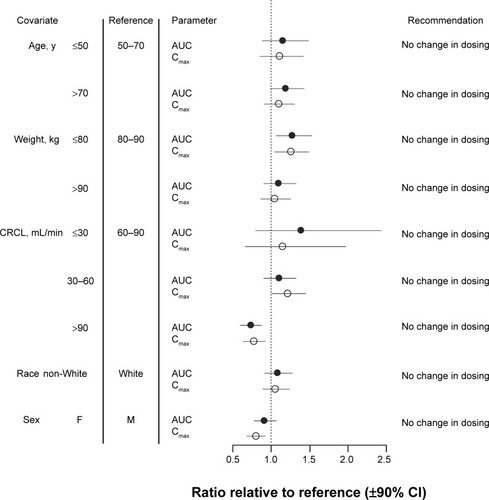
Figure S1 Time course of the observed and predicated plasma pegaptanib concentrations.
Notes: Data presented from samples obtained after the first and third doses, respectively, of pegaptanib (a and d) 0.3 mg, (b and e) 1.0 mg, and (c and f) 3.0 mg, per eye. Gray circles represent concentrations below the lower limit of quantification (BLQ); gray squares represent concentrations equal to or less than BLQ. Model predications plotted here determined using the final model assuming a fixed dosing interval of 6 weeks. The median and IPREDmed were calculated by time-interval bins. For visual clarity, only statistics with more than five observations are plotted.
Abbreviations: F, females; h, hours; IPREDmed, median of individual PRED prediction; M, males; PRED, prediction.
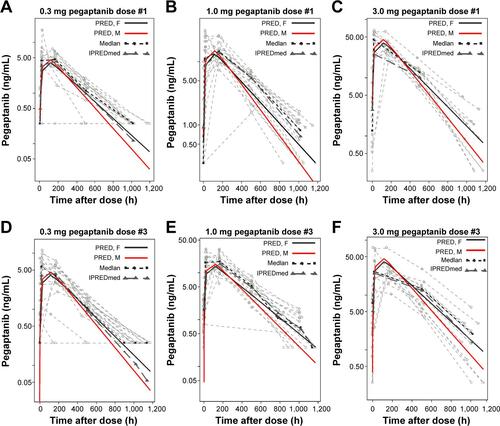
Figure S2 Final model predictions of clearance divided by AUC vs creatinine clearance (CRCL) normalized to the 0.3 mg dose of pegaptanib: (CL/AUC) vs CRCL.
Notes: The plot was composed of dose-normalized data to increase the sample size and improve estimate precision. Model (Est =0.49) is the power parameter from the final model, least squares (LS) regressions were performed for LogCL vs LogCRCL, and the estimate of the slope coefficient is LSFit (Est =0.494). The P-value for the t-test of the LS regression coefficient against the null value of 0 is LSFit (P<0.0001). A smoother is also provided. These analyses were performed using S-Plus (TIBCO Software, Palo Alto, CA, USA).
Abbreviations: AUC, area under the concentration–time curve; AUC0–inf, AUC from time 0 to infinity; CL, clearance; Est, estimated slope; h, hour; min, minute; LSFit, least squares regression fit; logCL, log of clearance; logCRCL, log of creatinine clearance; vs, versus.
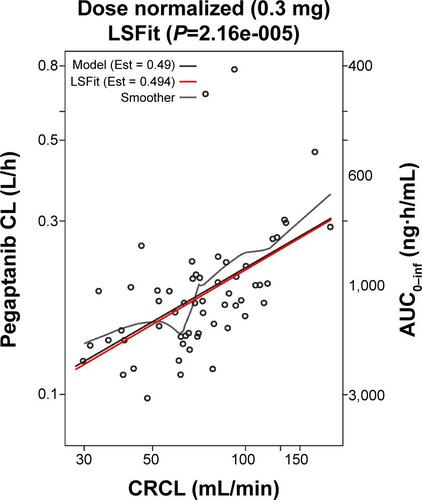
Figure S3 The influence of sex on the relationship between the predicted maximum concentration (Cmax) of pegaptanib and creatinine clearance (CRCL).
Notes: CRCL was previously found to influence clearance and thus, Cmax, the influence of CRCL on the predicted Cmax after a single, 0–3 mg dose of pegaptanib in (A) females and (B) males. The dashed line represents the 90% CI. The ratios of Cmax for CRCL 30 and 190 mL/min are predicted to be twofold in both females and males.
Abbreviations: CI, confidence interval; min, minute.
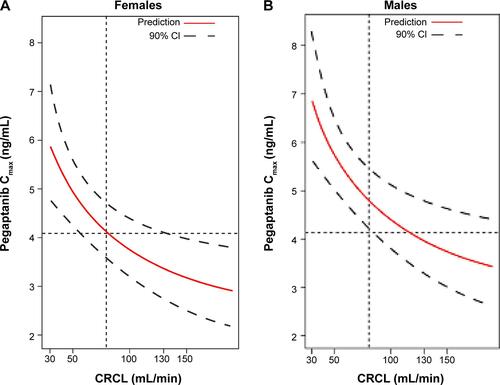
Table S1 Nominal schedule of plasma sampling for pharmacokinetic analysis
Table S2 Number of patients, observations, BLQs, and exclusions