
Figures & data
Figure 1 Surgical technique of modified filtering trabeculotomy.
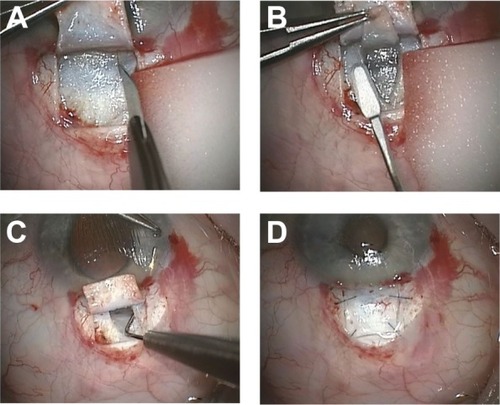
Table 1 Demographic data of both groups at baseline
Figure 2 Kaplan–Meier survival curve of complete success. Complete success was defined as an intraocular pressure (IOP) of <18 mmHg and IOP reduction of 30% or more without medication. Success rates were not significantly different (Plog-rank=0.25) between both groups during follow-up. One patient treated with modified filtering trabeculotomy (FTO) was lost to follow-up, therefore data were available for 29 patients (96.7%) prospectively followed for 12 months. Of the 87 conventional trabeculectomy (trab) patients, data for 71 patients (81.6%) were available at the 1-year visit. Patients with a follow-up of <12 months were counted as success or failure until the time point of drop out and were marked as censored.
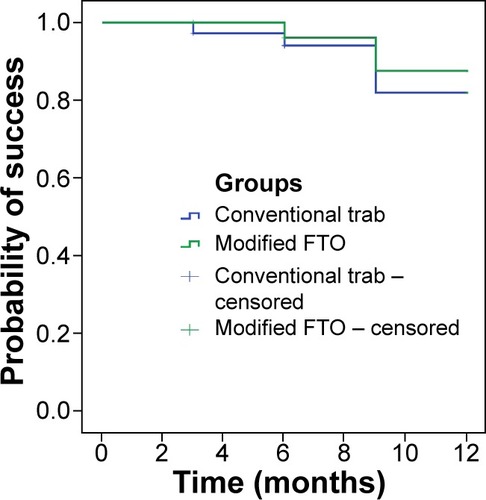
Table 2 Complete successTable Footnotea
Figure 3 Intraocular pressure (IOP) results over 12 months of follow-up. IOP was significantly reduced in both groups during follow-up (P<0.001). IOP was significantly lower in the modified filtering trabeculotomy (FTO) group than in the conventional trabeculectomy (trab) group at 1 day and 6 months after surgery. No statistical differences between groups were found for the remaining time points. One patient treated with FTO was lost to follow-up, therefore the data for 29 patients (96.7%) were prospectively followed for 12 months. Of the 87 trab patients, data for 71 patients (81.6%) were available at the 1-year visit.
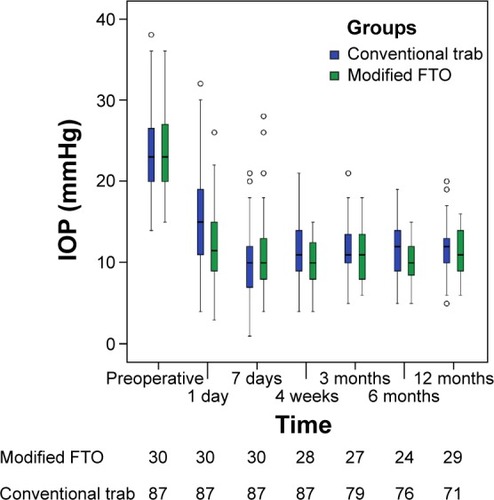
Figure 4 Scatter plots of (A) intraocular pressure (IOP) and (B) visual acuity (VA) results compared with preoperative values for both groups. (A) Eyes below the line of 18 mmHg and 30% IOP reduction fulfilled both criteria of success with or without medication (qualified success). (B) The association of preoperative VA with values at 12 months differed between the trabeculectomy (trab) and modified filtering trabeculotomy (FTO) groups (P-value for interaction <0.01). Postoperative VA was significantly better in patients undergoing FTO.
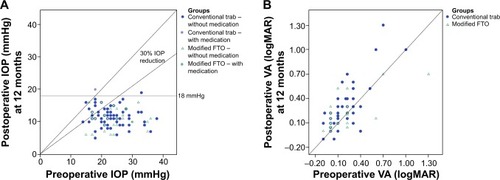
Table 3 Postoperative complications and interventions