Figures & data
Figure 1 Central and corneal fluorescein staining.
Notes: Changes from baseline for all evaluable eyes (n=75). In the central region, the mean score decreased to 0.95 from 1.25 (P=0.017). For the corneal sum, the mean score decreased to 4.95 from 5.55 (P=0.011). Statistical significance is denoted by *.
Abbreviation: n, number.
Abbreviation: n, number.
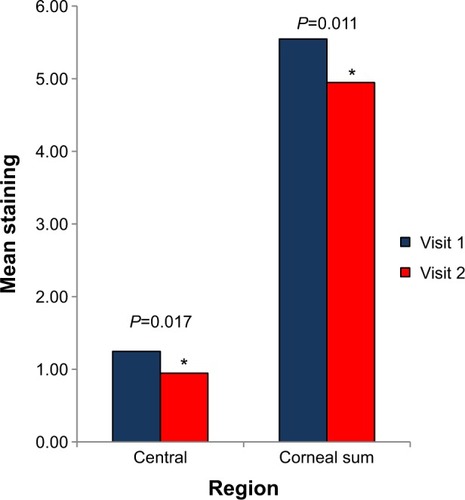
Figure 2 Ocular symptoms.
Notes: Changes from baseline measurements for the ITT population (n=42). Significant reductions were observed in discomfort (1.95 on the second visit versus 2.55 on the first visit; P=0.0017), dryness (2.02 on the second visit versus 2.88 on the first visit; P<0.001), and grittiness (1.02 on the second visit versus 1.40 on the first visit; P=0.0217). Although burning and stinging scores were lower on the second visit than on the first visit, these reductions were not significant. The overall reduction of all ocular symptoms from baseline (ie, the scores for all five symptoms combined) was significant (6.67 on the second visit versus 8.71 on the first visit; P<0.001). Statistical significance is denoted by *.
Abbreviations: ITT, intent to treat; n, number.
Abbreviations: ITT, intent to treat; n, number.
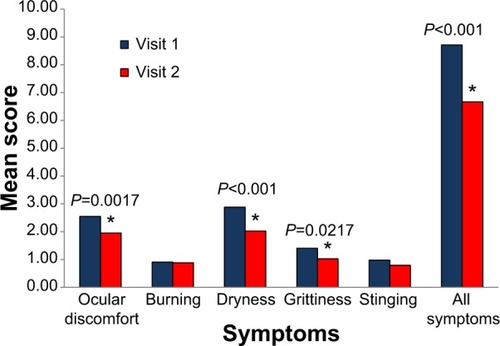
Figure 3 MBA on the second visit, predose and postdose values.
Notes: Results for all evaluable eyes (n=75). There was a significant improvement in postdose tear film stability as measured by the percent change in MBA from the predose readings (0.25% postdose MBA versus 0.41% predose MBA; P=0.026), a reduction of approximately 40%. Statistical significance denoted by *.
Abbreviations: MBA, mean breakup area; n, number.
Abbreviations: MBA, mean breakup area; n, number.
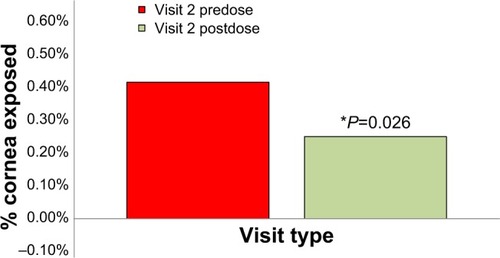
Figure 4 Mean time at corrected VA on first and second visits.
Notes: Average time at corrected VA during the IVAD test for all evaluable subjects (n=32). Although time at corrected VA increased by 41% at the second visit versus the first visit, this improvement did not achieve statistical significance (12.18 versus 8.59 seconds; P=0.0697).
Abbreviations: VA, visual acuity; IVAD, Interblink Interval Visual Acuity Decay.
Abbreviations: VA, visual acuity; IVAD, Interblink Interval Visual Acuity Decay.
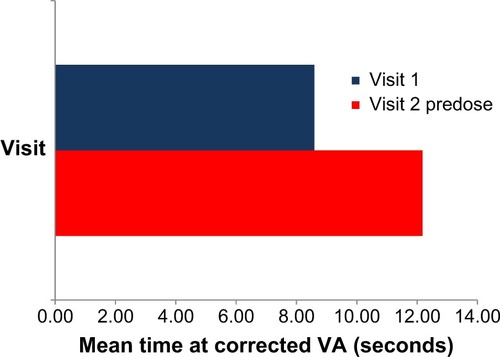
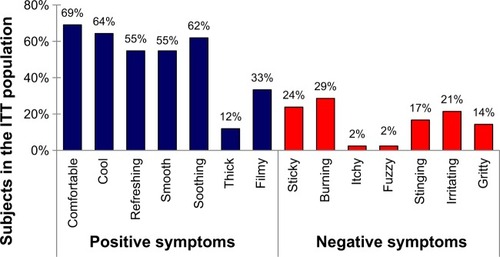
Figure 5 Responses to the Drop Comfort Questionnaire.
Notes: Percentages of subjects in the ITT population (n=42) who chose each descriptor word in the Drop Comfort Questionnaire. On the Drop Comfort Questionnaire, the majority of the subjects selected positive descriptor words after the dose given on the first visit and after the dose given on the second visit. The percentage of subjects that selected the positive descriptor words of cool, refreshing, smooth, soothing, and comfortable ranged from 55% to 69%.
Abbreviations: ITT, intent to treat; n, number.
Abbreviations: ITT, intent to treat; n, number.