
Figures & data
Table 1 Baseline patient characteristics in the two treatment groups
Figure 1 The change in the mean logarithm of the minimum angle of resolution best-corrected visual acuity (logMAR BCVA) from baseline to month 12.
Notes: In the one-injection group (solid circles), the mean logMAR BCVA improved slightly from 0.56 at baseline to 0.47 at month 1 (P=0.04) and improved significantly to 0.33 at month 12 (P<0.001). in the three-injection group (open circles), the mean logMAR BCVA improved further to 0.40 at month 1 (P<0.001) and improved significantly from 0.55 at baseline to 0.26 at month 12 (P<0.001). There was no significant between-group difference in the mean logMAR BCVA at month 12 (P=0.389).
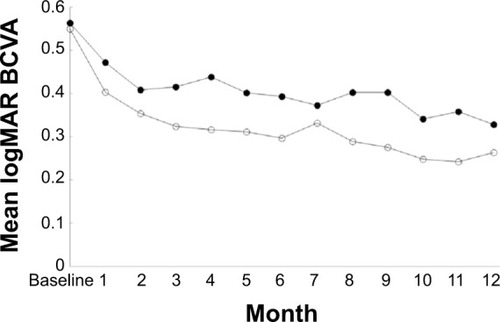
Figure 2 The mean change in central foveal thickness (CFT) from baseline to month 12.
Notes: The mean CFT decreased significantly from 598±186 μm at baseline to 348±134 μm at month 12 in the one-injection group (solid circles; P<0.001) and from 514±172 μm at baseline to 293±102 μm at month 12 in the three-injection group (open circles; P<0.001). There was no significant between-group difference in the mean CFT at month 12 (P=0.101).
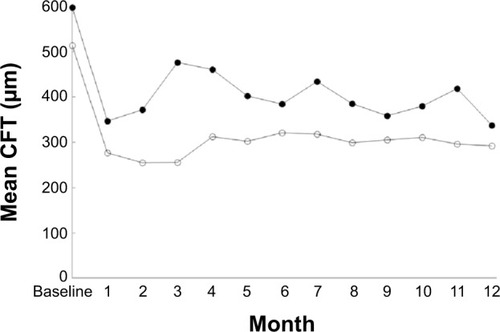
Table 2 Comparison of results of intravitreal injection of bevacizumab at 12 months between previous studies and the current study