
Figures & data
Table 1 Comparison of present study demographics and mean baseline vision to pivotal trials
Figure 1 Graph comparing the visual outcomes after 1 year from this study to the CATT, ANCHOR, and MARINA trials.
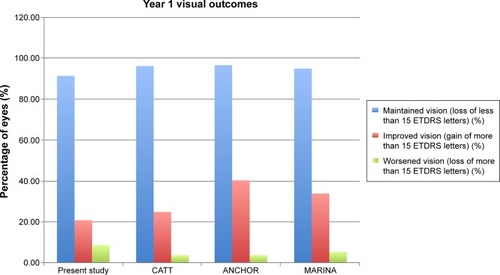
Figure 2 Graph comparing the visual outcomes after 2 years from this study to the CATT, ANCHOR, and MARINA trials.
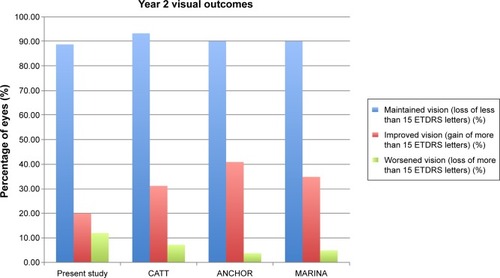
Table 2 Comparison of present study visual outcomes and number of ranibizumab treatments to pivotal trials
Figure 3 A graph comparing the mean visual progression of this study to the CATT, ANCHOR, and MARINA trials
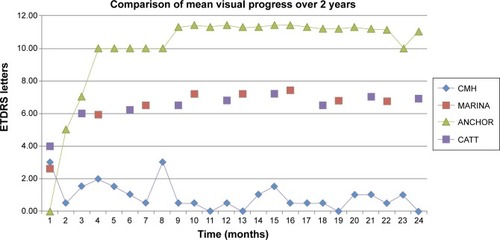
Figure 4 A graph comparing the mean visual acuity of this study to the CATT, ANCHOR, and MARINA trials.
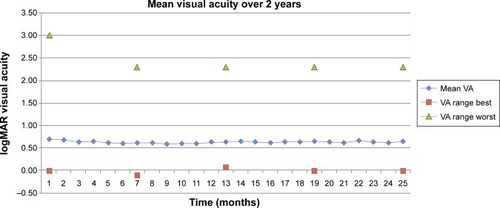
Figure 5 A graph comparing the visual outcomes of this study to ten other single-center studies of real-life populations.
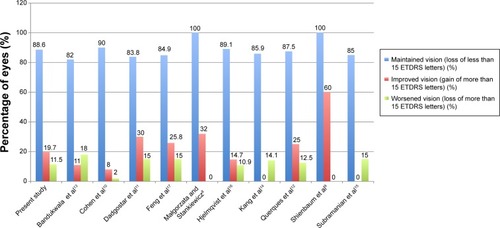
Table 3 Comparison of present study results to ten other studies of real life AMD populations treated with ranibizumab monotherapy around the world