
Figures & data
Figure 1 Self-administered questionnaire used in the study.
Notes: Questions 1 and 2 were asked at each visit, and Question 3 was asked only at 12 months after the surgery.

Figure 2 Method of determining the metamorphopsia score using M-CHARTS.
Notes: The minimum angle of the dots that appeared straight was taken to be the metamorphopsia score. In this case, metamorphopsia for vertical lines (MV) is 0.4.
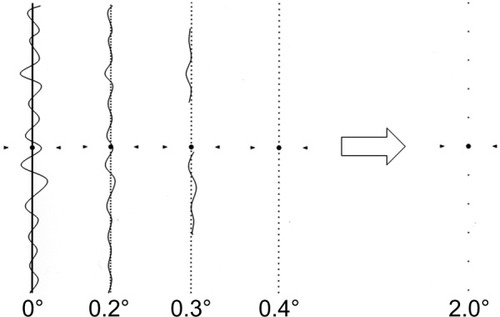
Table 1 A contingency table of diagnostic tests
Table 2 Examples of concerning explanation variables
Table 3 Baseline demographic data of patients with ERM in Part 1 and Part 2
Figure 3 Changes in the percentage of patients without metamorphopsia and the mean metamorphopsia scores.
Notes: The percentage of patients without metamorphopsia increased as the metamorphopsia scores decreased until finally 35.4% of patients had no metamorphopsia in their daily life at 12 months. Error bars indicate standard error. *,†Statistically significant compared with the metamorphopsia score at baseline (P<0.001), n=65.
Abbreviations: MV, metamorphopsia for vertical lines; MH, metamorphopsia for horizontal lines.
Abbreviations: MV, metamorphopsia for vertical lines; MH, metamorphopsia for horizontal lines.

Figure 4 ROC curve for six variables to predict the change in the metamorphopsia in daily life.
Notes: The ROC curve with the largest AUC was obtained for the M2-value. M1 = either (MHpost-MHpre) or (MVpost-MVpre), whichever of these absolute values was larger was used. M2-value = either (logMHpost-logMHpre) or (logMVpost-logMVpre), whichever of these absolute value was larger was used.
Abbreviations: ROC, receiver operating characteristic; AUC, area under the ROC curve; logMV, logarithm of MV score; logMH, logarithm of MH score; MV, metamorphopsia for vertical lines; MH, metamorphopsia for horizontal lines.
Abbreviations: ROC, receiver operating characteristic; AUC, area under the ROC curve; logMV, logarithm of MV score; logMH, logarithm of MH score; MV, metamorphopsia for vertical lines; MH, metamorphopsia for horizontal lines.
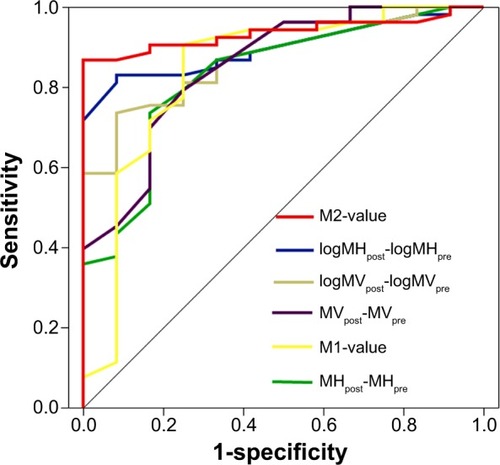
Table 4 Comparison of AUC for six variables
Table 5 Reproducibility of M-CHARTS scores