Figures & data
Table 1 Clinical characteristics of choroidal osteoma patients
Figure 1 Response of choroidal osteoma to intravitreal injections of bevacizumab.
Notes: The left and right vertical axes in the graph represent LogMARvisual acuity (VA) and central foveal thickness, respectively. The horizontal axis is the time course from the initial visit. (A) In case 1, VA was temporarily decreased. However, at the final follow-up, the central foveal thickness was 181 μm and LogMAR VA was 0.15. VA remained unchanged at the final visit compared with the initial visit. (B) In case 2, central foveal thickness was decreased from 343 μm to 119 μm. LogMAR VA changed from 0.04 to 0.69. There were no data on the central foveal thickness before 54 months because we introduced spectral domain optical coherence tomography in our hospital in 2009. (C) In case 3, the central foveal thickness was 454 μm at the final visit. VA temporarily improved, but LogMAR VA changed from 0.09 to 1.00. Arrows denote intravitreal injections of bevacizumab.
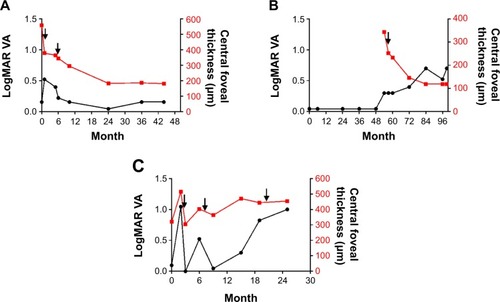
Figure 2 Thickness of the choroidal osteoma using enhanced depth imaging optical coherence tomography.
Notes: The vertical axis is the thickness of the tumor. The horizontal axis is the time course from the first enhanced depth imaging optical coherence tomography measurement. (A) Case 1, (B) case 2, and (C) case 3. The thickness of the choroidal osteoma was decreased in all cases at the final follow-up. (C) Intravitreal injections of bevacizumab (arrow) temporarily increased the tumor thickness.
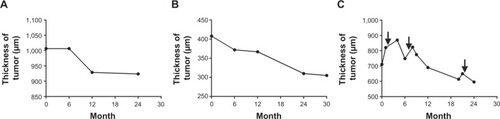
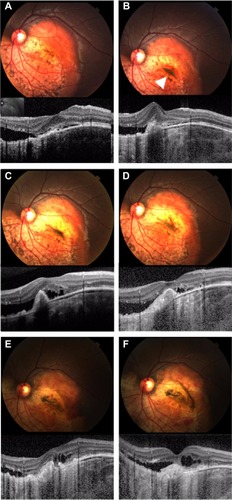
Figure 3 Photograph and spectral domain optical coherence tomography findings for case 1.
Notes: (A) First visit. Spectral domain optical coherence tomography shows choroidal neovascularization (CNV) with subretinal fluid located in the juxtafoveal area. Insert shows fundus image for scan marking. (B) One month after the first visit. Photograph showing subretinal pigmentation (arrowhead) around the CNV with subretinal hemorrhage. (C) Five months after the first visit. The patient had a recurrence of CNV and new subretinal pigmentation (arrowhead) around the CNV. (D) Six months after the first visit. Subretinal fluid and CNV remained unchanged approximately 1 month after intravitreal injections of bevacizumab. (E) Eighteen months after the first visit. Subretinal pigmentation and subretinal fluid disappeared. Spectral domain optical coherence tomography showed that the retinal structure in the subfoveal area did not disappear.
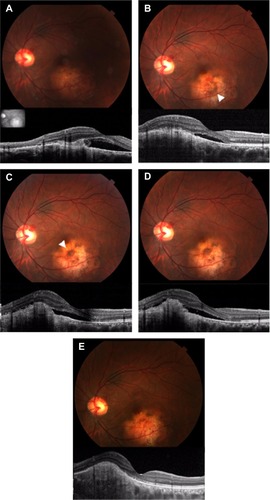
Figure 4 Photograph and spectral domain optical coherence tomography (SD-OCT) findings for case 2.
Notes: (A) Thirty-one months after the first visit. A fundus photograph shows yellow–white lesions of approximately five disk diameters in size. There is no SD-OCT findings in the first visit of case 2. (B) Forty-three months after the first visit. SD-OCT shows subfoveal choroidal neovascularization with retinal edema and subretinal fluid. White arrow denotes longitudinal scans of the SD-OCT. (C) Forty-seven months after the first visit. Intravitreal injections of bevacizumab decreased the choroidal neovascularization and subretinal fluid. (D) Ninety-nine months after the first visit. Fundus photograph and SD-OCT show retinal pigment epithelium atrophy.
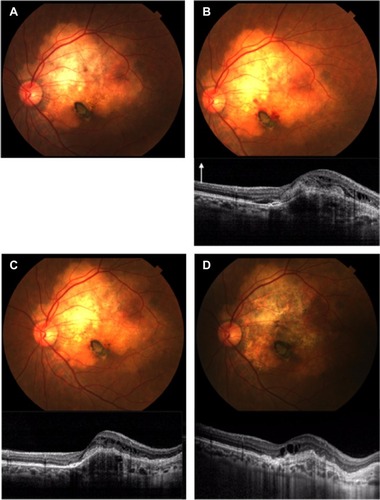
Figure 5 Photograph and spectral domain optical coherence tomography findings for case 3.
Notes: (A) First visit. Fundus photograph shows yellow–white and orange lesions of approximately four disk diameters in size. Insert shows fundus image for scan marking. (B) One month after the first visit. Spectral domain optical coherence tomography shows choroidal neovascularization with subretinal fluid. Fundus photograph shows subretinal pigmentation (arrowhead) near the choroidal neovascularization. (C) Three months after the first visit. After the first intravitreal injection of bevacizumab, the subretinal fluid did not decrease. (D) Eight months after the first visit. Fundus photograph showing a pale subretinal pigmentation. (E) Twenty months after the first visit. Fundus photograph showing that the decalcified region and subretinal pigmentation were wider than observed at the first visit. (F) Twenty-five months after the first visit. The retinal pigment epithelium atrophy finally resulted in subretinal fluid and retinal edema.