
Figures & data
Table 1 Demographics and baseline characteristics
Figure 1 Patients’ current glaucoma treatment (N=164).
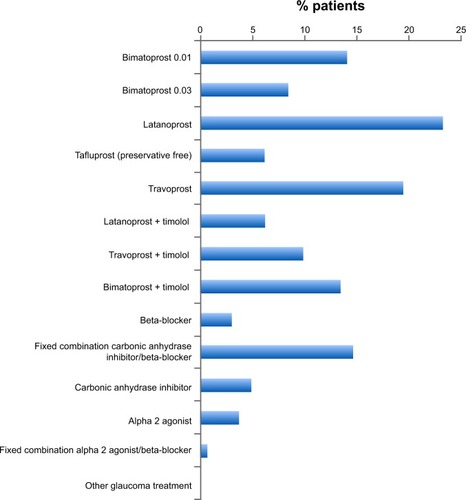
Table 2 Duration of previous treatment and number of treatment changes experienced by subjects
Figure 2 Proportion of patients experiencing symptoms between eye drop instillations (N=164).
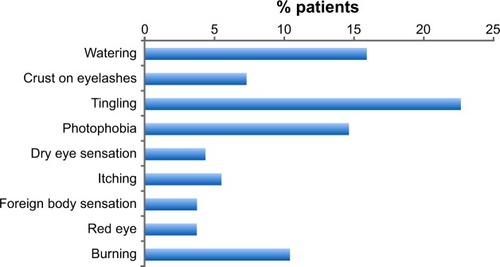
Figure 3 Proportion of patients exhibiting ocular signs at ophthalmological examination (N=164).
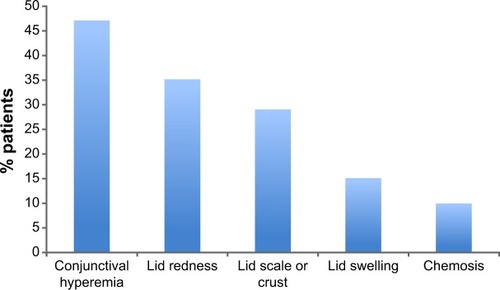
Figure 4 Proportion of patients reporting symptoms before and after the commencement of glaucoma therapy (N=164).
Abbreviation: MGD, meibomian gland dysfunction.
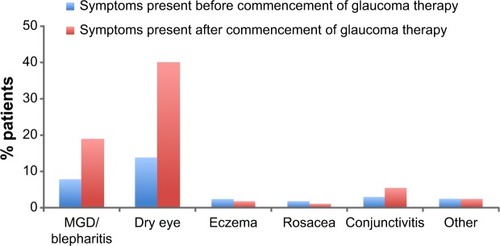
Table 3 Use of additional topical ocular therapy
Table 4 Parameters with significant association with patient satisfaction (univariate analysis)