Figures & data
Table 1 Top three most popular accounts on each social media platform (Facebook, Twitter, LinkedIn) of peer-reviewed journals, professional organizations, trade publications, and patient advocacy groups
Figure 1 Box and whisker plots depicting the number of Facebook “likes” for peer-reviewed journals, professional organizations, trade publications, and patient advocacy groups.
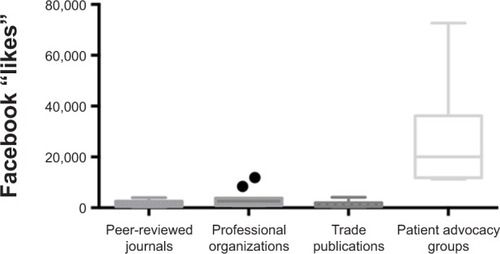
Figure 2 Box and whisker plots depicting the number of Twitter followers for peer-reviewed journals, professional organizations, trade publications, and patient advocacy groups.
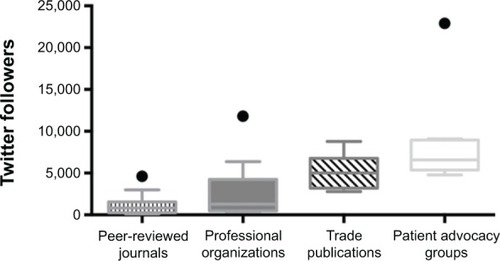
Figure 3 Box and whisker plots depicting the number of LinkedIn members for professional organizations and patient advocacy groups.
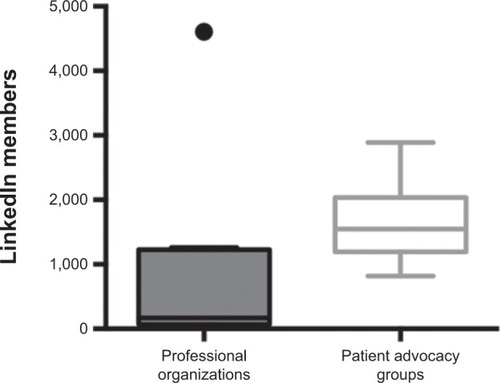
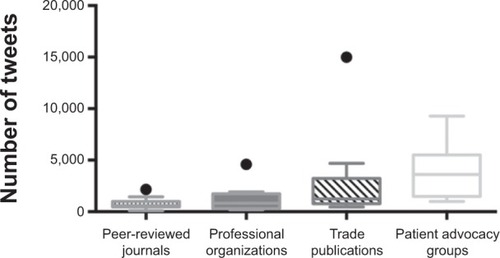
Figure 4 Box and whisker plots depicting the activity of peer-reviewed journals, professional organizations, trade publications, and patient advocacy groups on Twitter.