Figures & data
Table 1 Patient demographics and baseline values
Table 2 Individual patients: age, sex, best-corrected visual acuity (BCVA) at baseline, and prior medical treatments
Table 3 Individual patients: BCVA, CFT, and IOP pre- and postoperatively
Figure 1 BCVA at the preop versus the last follow-up visit for each individual patient.
Abbreviation: BCVA, best-corrected visual acuity.
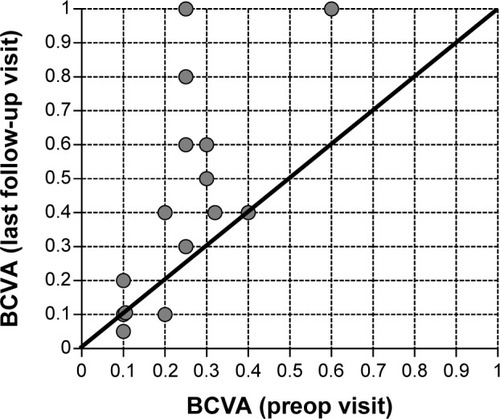
Figure 2 CFT at the preop visit versus the last follow-up visit for each individual eye.
Abbreviation: CFT, central fovea thickness.
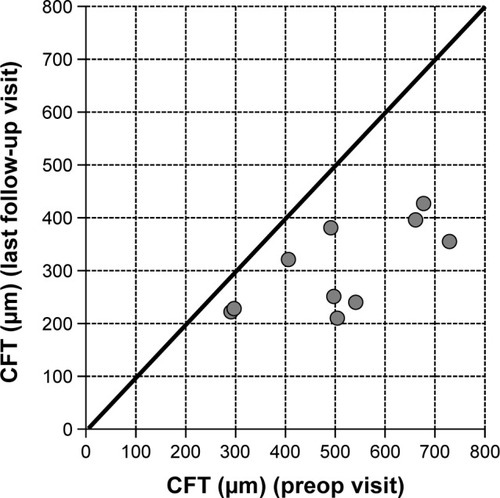
Figure 3 Fluorescence angiographic findings for patient number 5, left eye pre- and 2 months postinjection of 190 μg FAc. The intravitreal injection of FAc took place on September 26, 2013.
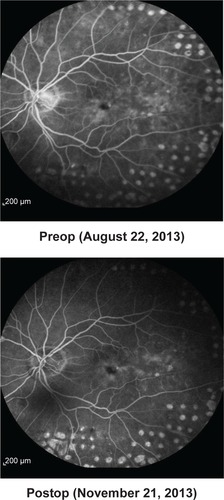
Figure 4 IOP at the preop visit versus the last follow-up visit for all individual eyes.
Abbreviation: IOP, intraocular pressure.
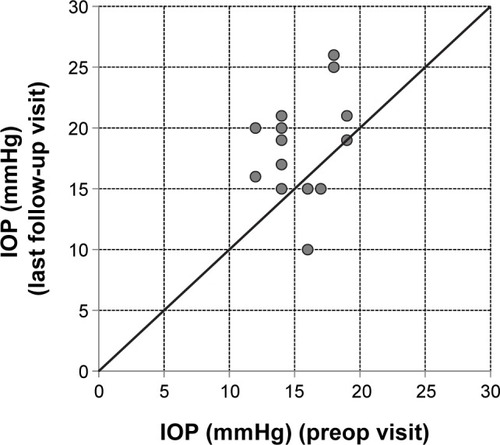
Figure 5 Data from patient number 2 showing OCT scans at pre- and postop visits.
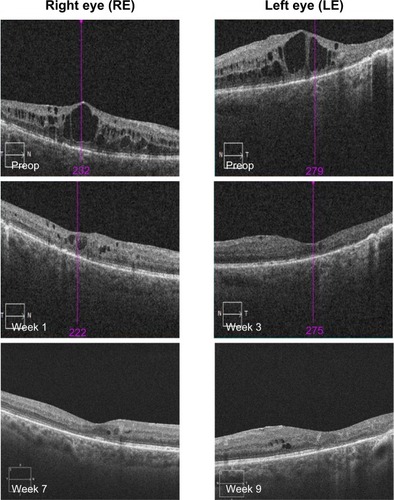
Figure 6 Data from patient number 2 showing BCVA at preop and postop visits.
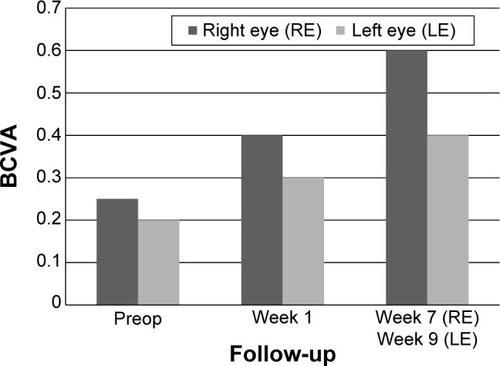
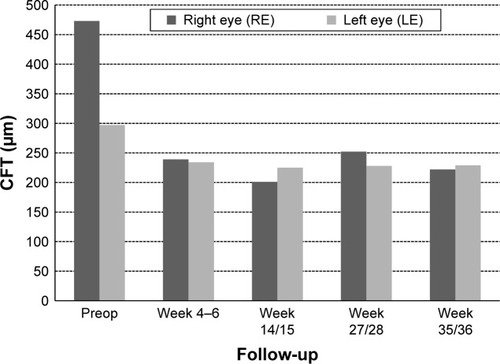
Figure 7 Data from patient number 2 showing CFT at preop and postop visits.
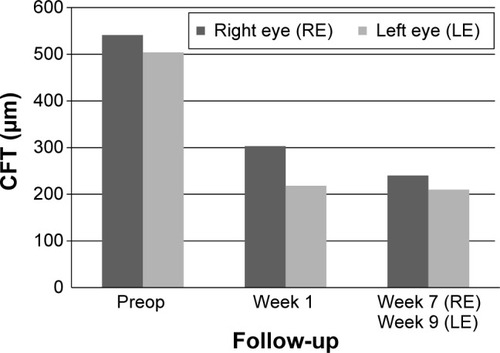
Figure 8 Data from patient number 3 showing OCT scans at pre- and postop visits.
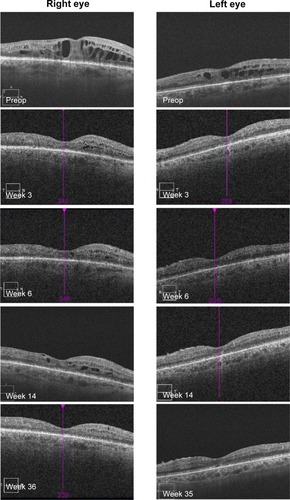
Figure 9 Data from patient number 3 showing visual acuity (BCVA) at preop and postop visits.
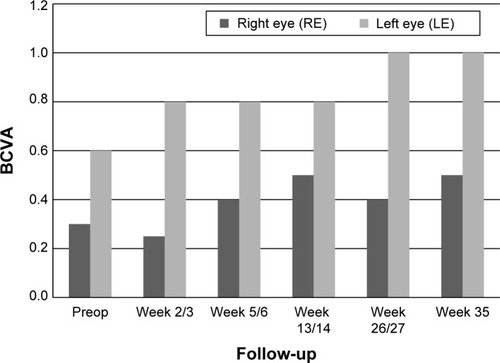
Figure 10 Data from patient number 3 showing CFT at pre- and postop visits.