
Figures & data
Figure 1 The distribution of age of all subjects.
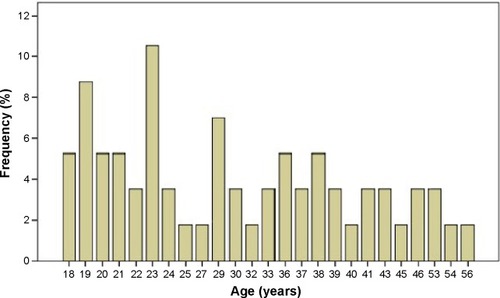
Figure 2 Box plot of peripapillary choroidal thickness values at each area measured by enhanced depth imaging optical coherence tomography.
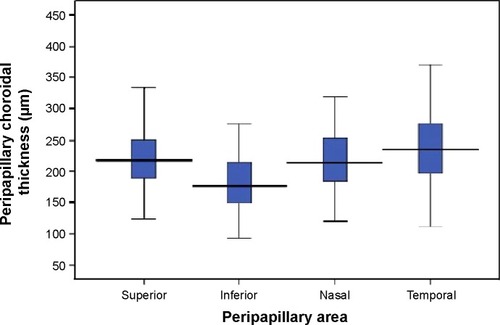
Table 1 Mean peripapillary choroidal thickness values and pair-wise comparison of each peripapillary area
Table 2 Correlation analyses of peripapillary choroidal thickness values between each peripapillary area
Table 3 Correlation analyses between peripapillary choroidal thickness values and age, axial length (AL), or spherical refraction (SR)
Table 4 Clinical features and choroidal thickness values of female and male subjects