
Figures & data
Table 1 Baseline demographics of patients treated with intravitreal dexamethasone implant injection
Table 2 Ocular diagnoses other than diabetic macular edema, retinal vein occlusion, and uveitis in study eyes included in the all eyes cohort
Table 3 Study eye characteristics and treatments and procedures administered prior to intravitreal dexamethasone implant injection
Table 4 Medications and procedures used adjunctively with intravitreal dexamethasone implant therapy
Figure 1 Peak mean change in BCVA (Snellen line equivalent) from baseline at 2–26 weeks after the last DEX implant injection.
Abbreviations: BCVA, best-corrected visual acuity; DEX, intravitreal dexamethasone; DME, diabetic macular edema; RVO, retinal vein occlusion; SE, standard error.
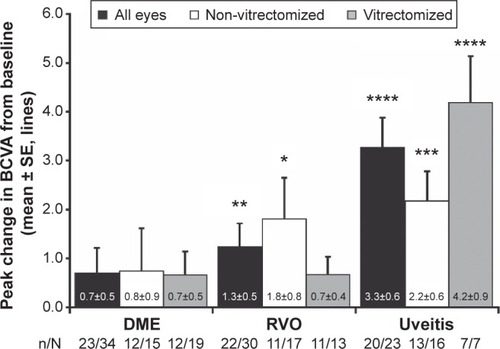
Figure 2 Proportion of study eyes with gains of 1 or more (A), 2 or more (B), and 3 or more (C) BCVA lines of vision after the first, second, and third DEX implant injection.
Abbreviations: BCVA, best-corrected visual acuity; DEX, intravitreal dexamethasone; DME, diabetic macular edema; RVO, retinal vein occlusion.
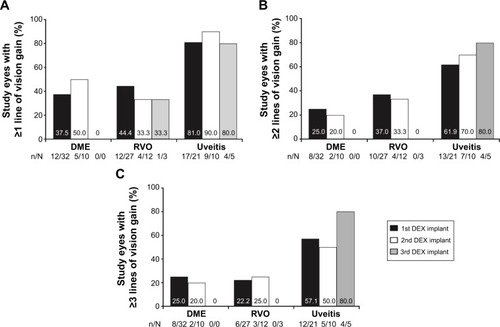
Figure 3 Peak mean change in CRT from baseline at 2–26 weeks after the last DEX implant injection.
Abbreviations: CRT, central retinal thickness; DEX, intravitreal dexamethasone, DME, diabetic macular edema; RVO, retinal vein occlusion; SE, standard error.
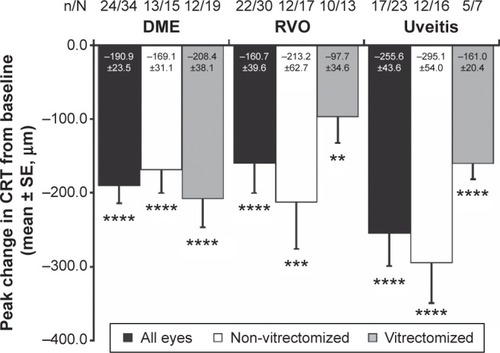
Figure 4 OCT retinal images from representative DME, BRVO, and uveitis study eyes at baseline and after treatment with the DEX implant. BCVA and CRT by OCT are indicated.
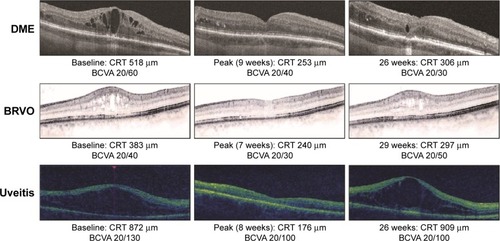
Table 5 Treatment-related adverse events occurring in >1% of all patients
Figure 5 Increase in IOP following treatment with the DEX implant.
Abbreviations: DEX, intravitreal dexamethasone; DME, diabetic macular edema; IOP, intraocular pressure; RVO, retinal vein occlusion.
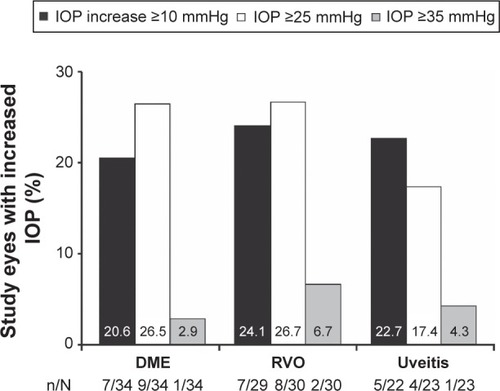
Figure 6 The proportion of study eyes requiring use of topical IOP-lowering medication(s) at any follow-up visit after DEX implant injection.
Abbreviations: DEX, intravitreal dexamethasone; DME, diabetic macular edema; IOP, intraocular pressure; RVO, retinal vein occlusion.
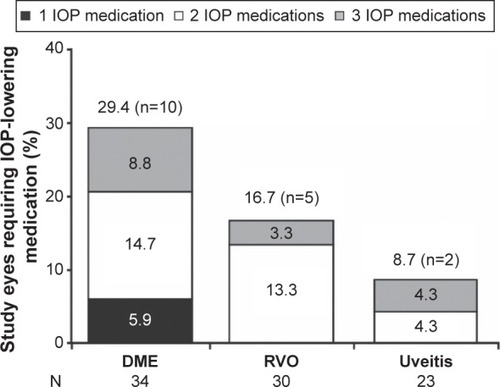
Table S1 Information collected at each retrospective study visit