
Figures & data
Figure 1 Pre- and post-injection quadrant and average RNFL thickness.
Abbreviation: RNFL, retinal nerve fiber layer.
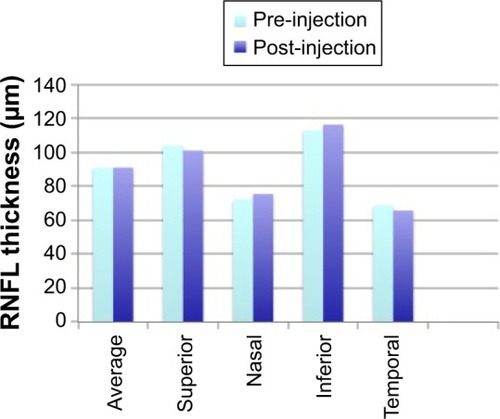
Table 1 Mean and standard deviation of signal strength, average RNFL, and quadrant RNFL thickness (in microns)
Table 2 Mean and standard deviation of signal strength, average RNFL, and quadrant RNFL thickness (in microns) in various types of CNV
Table 3 Mean and standard deviation of signal strength, average RNFL, and quadrant RNFL thickness (in microns) in different status of the lens