Figures & data
Table 1 Patient demographics (18 eyes of 18 patients)
Table 2 Clinical parameters of subjects with RVOs
Figure 1 Serum Nampt levels are lower in subjects with RVOs.
Notes: (A) Standard curve for serum Nampt levels obtained using a commercially available ELISA kit. The RCitation2 value indicated the goodness of fit after fifth-parameter nonlinear fit regression. (B) Serum Nampt levels are lower in subjects with RVOs compared with healthy volunteers (n=6 controls, n=18 subjects with RVO; unpaired t-test: P<0.05). (C) There is no statistically significant difference in serum Nampt levels among different types of RVOs. Bars represent mean ± SEM. *P<0.05, **P<0.01, ***P<0.001.
Abbreviations: A450, absorbance at 450 nm; BRVO, branch retinal vein occlusion; CRAO, central retinal artery occlusion; CRVO, central retinal vein occlusion; ELISA, enzyme-linked immunosorbent assay; HRVO, hemiretinal vein occlusion; Nampt, nicotinamide phosphoribosyltransferase; RVO, retinal vascular occlusion; SEM, standard error of the mean.
Abbreviations: A450, absorbance at 450 nm; BRVO, branch retinal vein occlusion; CRAO, central retinal artery occlusion; CRVO, central retinal vein occlusion; ELISA, enzyme-linked immunosorbent assay; HRVO, hemiretinal vein occlusion; Nampt, nicotinamide phosphoribosyltransferase; RVO, retinal vascular occlusion; SEM, standard error of the mean.
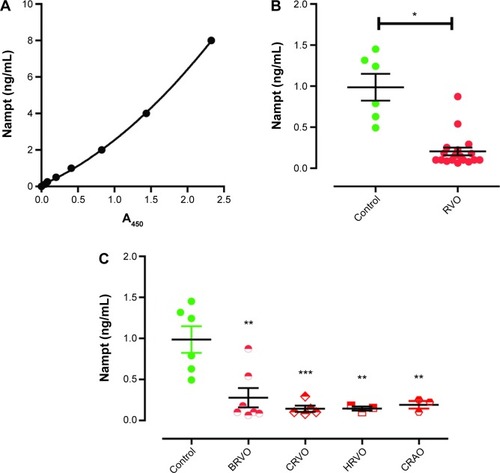
Table 3 SNP determination
Figure 2 Serum Nampt levels do not correlate with visual acuity or SD-OCT findings.
Notes: (A) Serum Nampt levels in patients with a history of retinal blood vessel occlusions did not correlate with improvement of visual acuity after clinical intervention, expressed as the improvement in logMAR scores (RCitation2=0.006). (B–D) Furthermore, there was no statistically significant correlation between serum Nampt levels and retinal thickness, as determined by SD-OCT. Correlations are shown for serum Nampt levels with retinal thickness on the outer and inner circles, as well as the center retinal thickness measurement.
Abbreviations: logMAR, logarithm of the minimum angle of resolution; Nampt, nicotinamide phosphoribosyltransferase; SD-OCT, spectral-domain optical coherence tomography.
Abbreviations: logMAR, logarithm of the minimum angle of resolution; Nampt, nicotinamide phosphoribosyltransferase; SD-OCT, spectral-domain optical coherence tomography.
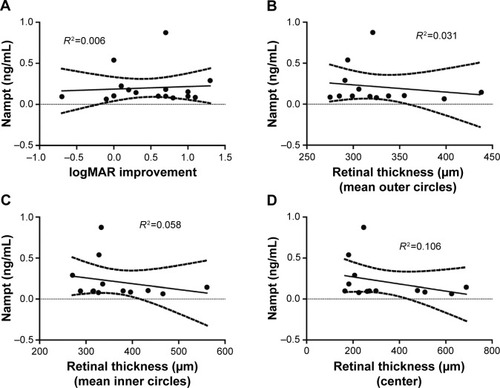
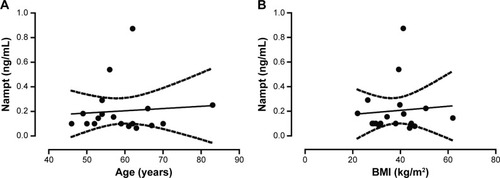
Figure 3 Serum Nampt levels do not correlate with age or BMI.
Notes: (A) We tested for an association between serum Nampt levels and age by calculating a Pearson product–moment correlation coefficient. The solid line represents the line of best fit (RCitation2=0.006), while the dotted lines represent the 95% confidence interval. There was no statistically significant association between serum Nampt levels and age (P=0.75). (B) Similarly, we did not identify a statistically significant association between serum Nampt levels and BMI (RCitation2=0.007; P=0.75).
Abbreviations: BMI, body mass index; Nampt, nicotinamide phosphoribosyltransferase.
Abbreviations: BMI, body mass index; Nampt, nicotinamide phosphoribosyltransferase.