
Figures & data
Figure 1 Map showing centers of the US-based epidemiological studies (created in Microsoft MapPoint® 2013; Microsoft Corp, Redmond, WA, USA).
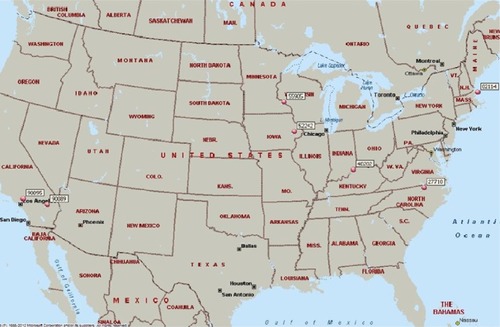
Figure 2 Mean age at diagnosis and presentation.
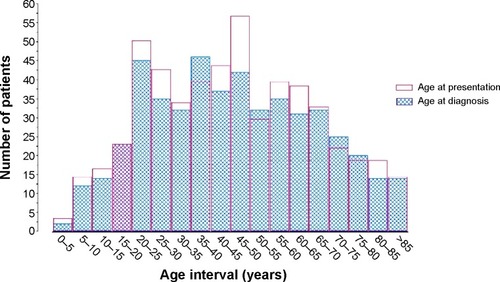
Table 1 Age groups
Table 2 Distribution of diagnoses by sex
Table 3 Distribution of diagnoses by race
Table 4 Multivariate analysis for race and sex
Figure 3 Map of Virginia with the residential postal codes of the patients.

Table 5 States of residence for patients seeking care at the University of Virginia
Table 6 Change in visual acuity
Table 7 Ophthalmic management and interventions
Table 8 Anatomical classification
Figure 4 Differentiated (diagnosed) vs undifferentiated (undiagnosed) cases.
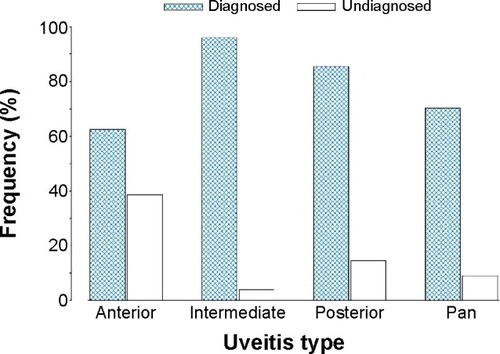
Table 9 Uveitis diagnoses at University of Virginia
Table 10 Multicenter comparison of anatomic location of uveitis
Table 11 Relative frequencies of key uveitis diagnoses
Table 12 Anterior uveitis diagnoses
Table 13 Intermediate uveitis diagnoses
Table 14 Posterior uveitis diagnoses
Table 15 Panuveitis diagnoses