Figures & data
Table 1 Demographics of the subjects included in the study
Table 2 Descriptive statistics for the central corneal thickness, as measured by the four different modalities
Figure 1 Bland–Altman plot with 95% limits of agreement (LOA) illustrates the difference in central corneal thickness measurements (y-axis) between values obtained by ultrasound pachymetry vs values obtained by slit-lamp optical coherence tomography (SL-OCT) against the average CCT measurements of the two methods (x-axis).
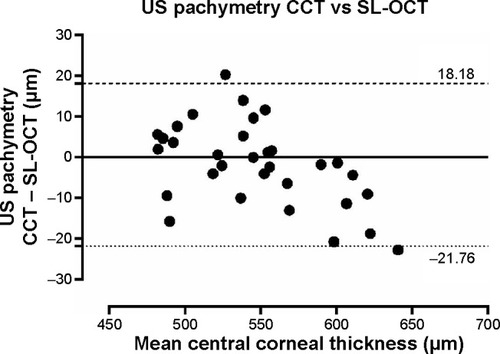
Figure 2 Bland–Altman plot with 95% limits of agreement (LOA) illustrates the difference in central corneal thickness measurements (y-axis) between values obtained by specular microscopy vs values obtained by ultrasound pachymetry against the average CCT measurements of the two methods (x-axis).
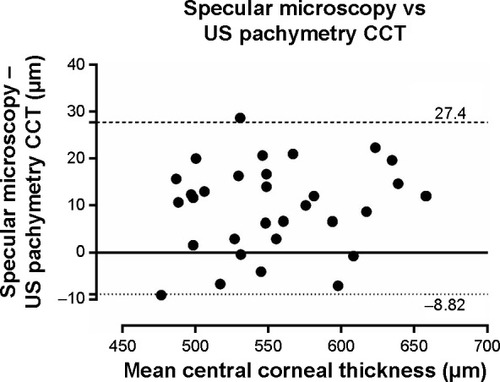
Figure 3 Bland–Altman plot with 95% limits of agreement (LOA) illustrates the difference in central corneal thickness measurements (y-axis) between values obtained by ultrasound pachymetry vs values obtained by Orbscan against the average CCT measurements of the two methods (x-axis).
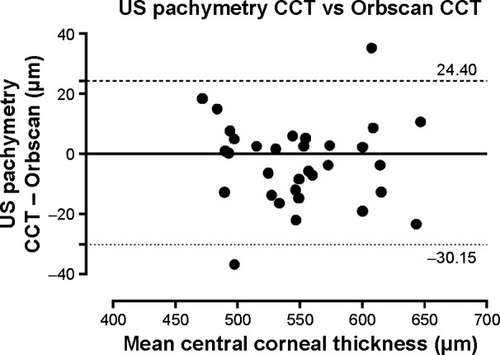
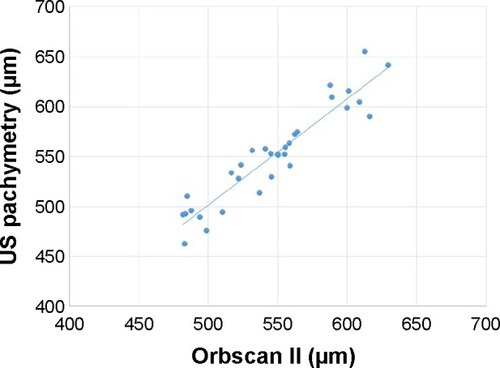
Figure 4 Scatter plot display of ultrasound pachymetry with SL-OCT measurement of CCT (r2=0.982).
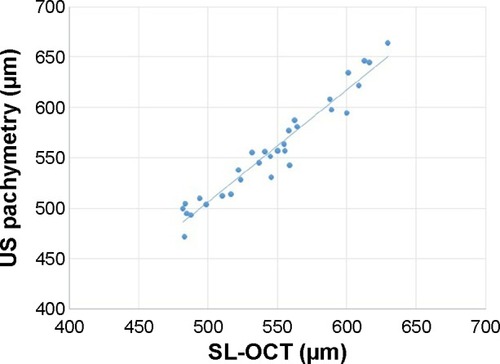
Figure 5 Scatter plot display of ultrasound pachymetry with specular microscopy measurement of CCT (r2=0.98).
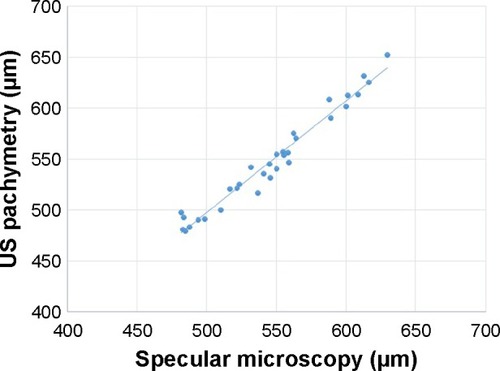
Figure 6 Scatter plot display of ultrasound pachymetry with Orbscan measurement of CCT (r2=0.96).